Market rally or collapse? This chart pattern says it all [Video]
![Market rally or collapse? This chart pattern says it all [Video]](https://editorial.fxsstatic.com/images/i/Economic-Indicator_Recession-5.png)
Watch the video from the WLGC session on 11 Feb 2025 to find out the following:
-
Is the market about to break out, or are we setting up for another selloff?
-
Are bulls gaining control, or is this just another fake rally before a bigger drop?
-
Why is the 6100 level so important, and what does it tell us about supply and demand?
-
What key signals should traders watch to anticipate the next big move?
-
and a lot more...
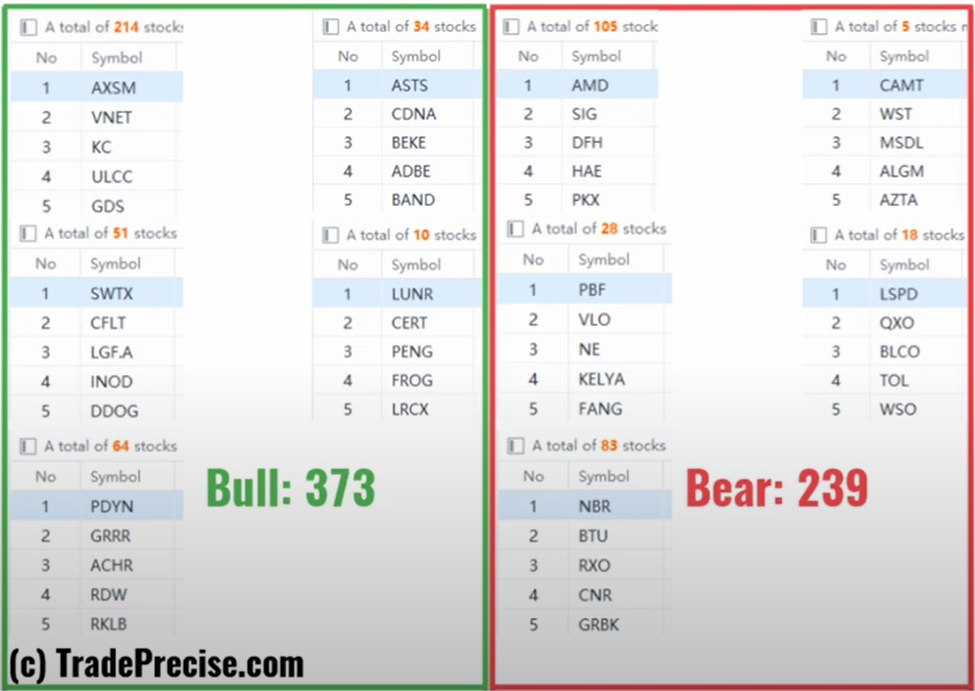
Market environment
The bullish vs. bearish setup is 373 to 239 from the screenshot of my stock screener below.
Three stocks ready to soar
18 actionable setups such as CART, LMND, RKLB were discussed during the live session before the market open (BMO).
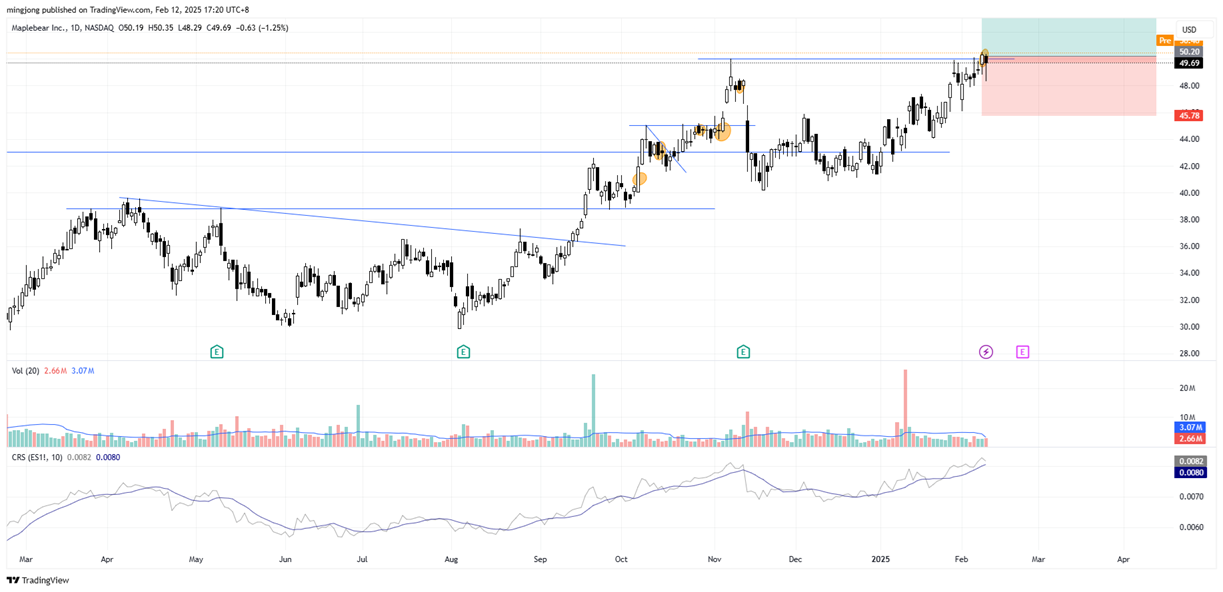
Maplebear (CART)
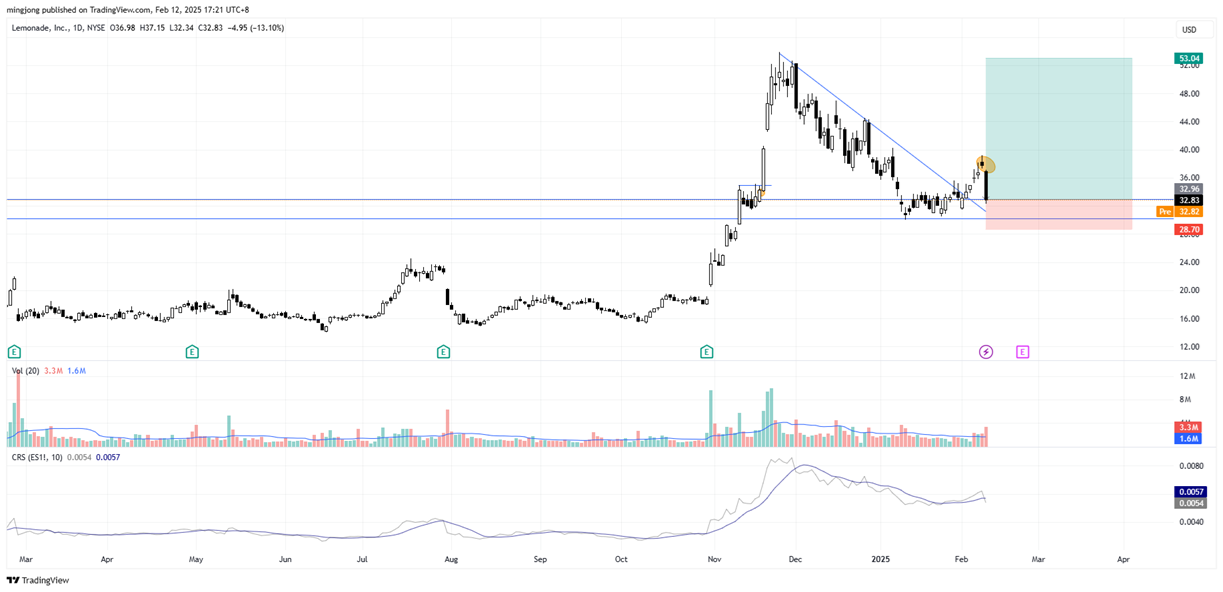
Lemonade (LMND)
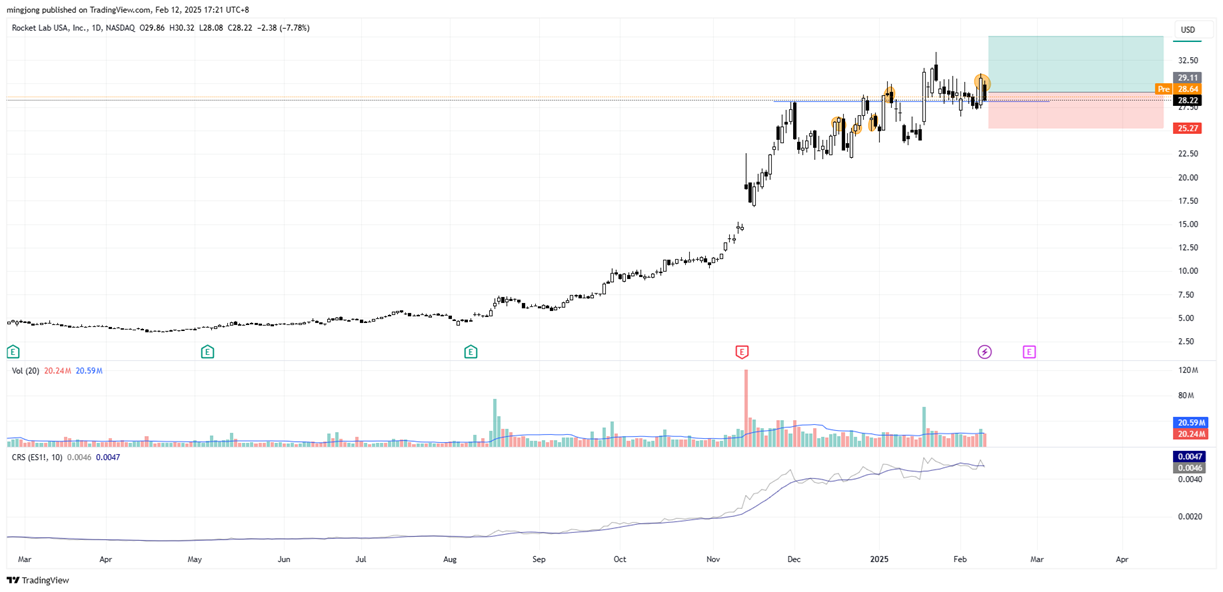
Rocket Lab USA (RKLB)
Author

Ming Jong Tey
Independent Analyst
Ming Jong Tey has been trading since 2008. He started his learning journey from technical analysis (indicators, Fibonacci, etc...) to value investing. Throughout his journey, he develops an interest in price action with chart pattern trading.


