|

KTB: Pulling back In II before next rally

Kontoor Brands Inc., (KTB) is a lifestyle apparel company, which designs, manufactures, procures, markets & distributes denim, apparel & accessories under Wrangler, Lee & Rock & Republic Brands globally. It operates through mainly Wrangler & Lee. It comes under Consumer cyclical sector & trades as “KTB” ticker at NYSE.

KTB made all time low at $12.90 on 4/03/2020 during global selloff in early 2020. Thereafter it made a higher high sequence, which ended at $69.16 high as I red. While below there, it favors correction of II against April-2020 low before upside resumes.

KTB – Elliott Wave latest daily view

KTB

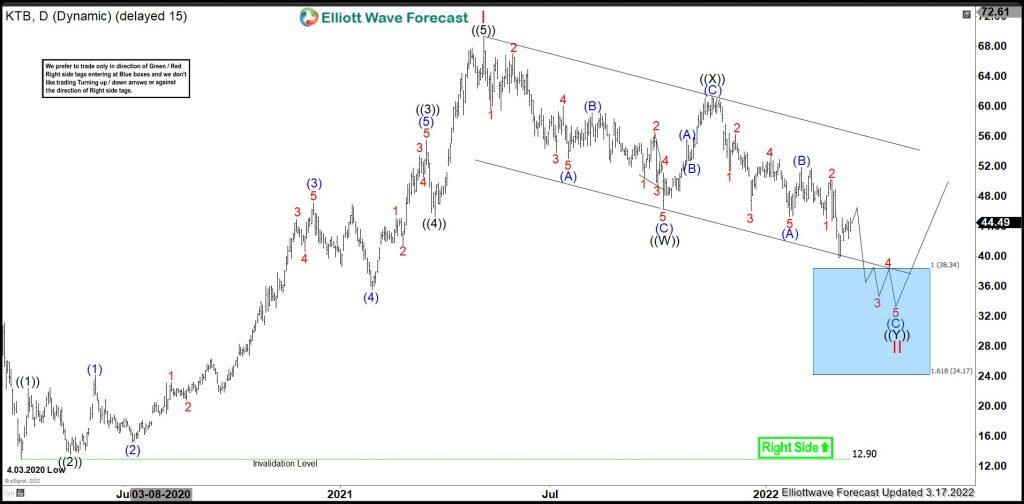
It started impulse cycle from 4/03/2020 low. It placed ((1)) at $22.43 high on 4/09/2020, while ((2)) at $13.53 low as dip correction against ((1)). While above $13.53 low, it started third wave of third wave extension & favored ended at $55.49 high on 3/18/2021. ((4)) was 0.236 retracement of ((3)) as shallow correction & ended at $45.23 low. Finally, it ended ((5)) at $69.16 high on 5/06/2021 as I red. While below there it favors double correction lower in II towards $38.34 – $24.17 area before upside resumes.

Below ATH of $69.16, it placed ((W)) at $46.31 low & ((X)) at $61.24 high on 11/16/2021. Below ((X)) high, it favored ended (A) & (B) at $51.85 high. While below there, it favors further weakness in (C) of ((Y)) towards equal leg area to end II correction before upside resumes or at least 3 swing bounce thereafter. We like to buy the extreme areas in blue box when reached.

Author

Elliott Wave Forecast Team

Elliott Wave Forecast Team

ElliottWave-Forecast.com

More from Elliott Wave Forecast Team
Share:

Editor's Picks

AUD/USD eyes 0.7150 barrier nine-day EMA

AUD/USD inches higher after registering modest losses in the previous day, trading around 0.7130 during the Asian hours. The technical analysis of the daily chart indicates that the pair is moving sideways within the rectangle pattern, suggesting a consolidation as neither the bulls nor the bears have enough momentum to take control of the market.

USD/JPY trades below 160.00 intervention threshold; bullish bias intact

The USD/JPY pair attracts some sellers during the Asian session amid fears that authorities will step in again to prop up the Japanese Yen. Furthermore, the Israel-Lebanon truce prompts some profit-taking around the US Dollar and exerts downward pressure on the currency pair.

Gold defends 200-day SMA at $4,425, but for how long?

Gold is attempting a tepid recovery toward $4,500 early Thursday, as renewed optimism in the Mideast geopolitical front calms market nerves. This cautious optimism across Asian markets weighs on Oil prices, and diminishes the US Dollar’s safe-haven appeal, helping Gold stage a decent comeback from the weekly low of $4,424.


Hyperliquid: ETF demand, capital rotation fuel HYPE rally as Bitcoin melts

Hyperliquid price sustains an upward trend near its all-time high of $75.76 on Thursday after posting 80% gains in May, while Bitcoin (BTC) retraces below $65,000, triggering a market-wide panic.

Kevin Warsh takes the Fed helm: What it means for the US Dollar
The Federal Reserve moves away from the highly predictable "forward guidance" model of the Jerome Powell era to a new “Kevin Warsh environment”, characterized by less communication, more policy surprises, and an increased focus on the Fed's complex balance sheet.
Recession on paper: What really moves the Canadian Loonie now?

Statistics Canada handed the headline writers a gift and the analysts a headache. Real GDP shrank 0.1% on an annualized basis in the first quarter, and with the fourth quarter of 2025 revised down to a 1.0% contraction, that is two negative quarters in a row, the textbook definition of a technical recession and Canada's first since the pandemic.