|

Kiwi struggles to maintain topside momentum, NZD/USD stuck near 0.6200

  • NZD/USD is having a hard time pushing off the 0.6200 handle despite a mid-week run above 0.6280.
  • Dovish Fed pivot has bolstered the broader FX market against the US Dollar, but Kiwi gains remain capped.
  • NZ, US PMIs to round out the trading week.

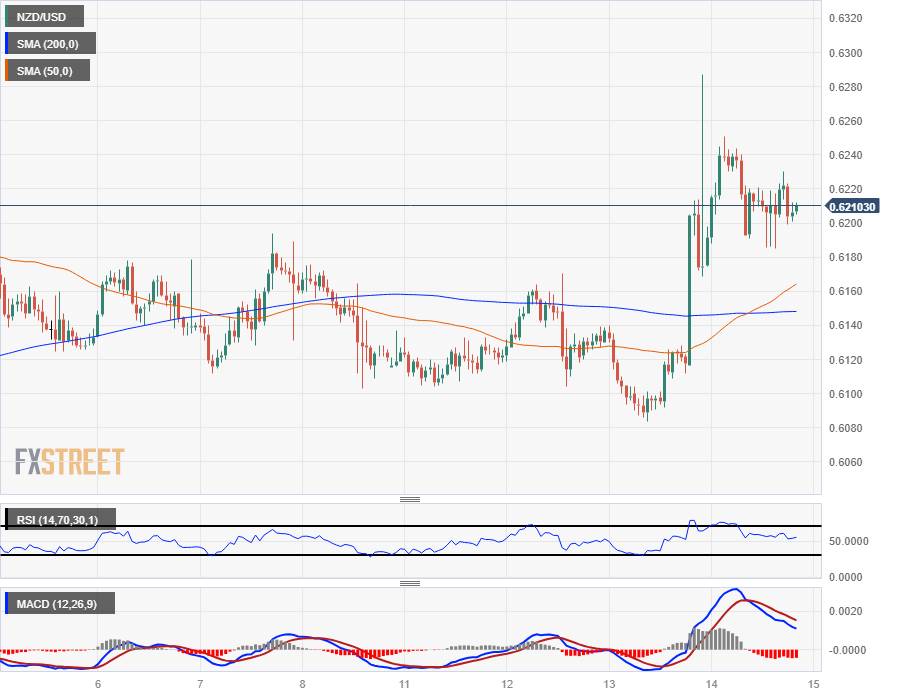
The NZD/USD is struggling to find further gains rounding the corner into Friday’s early market session, trading close to the 0.6200 handle after a bull run over 0.6280 sputtered out and sent the pair slumping back into near-term consolidation.

Despite the US Dollar (USD) declining across the board following a dovish pivot from the Federal Reserve (Fed) on Wednesday, the Kiwi (NZD) has struggled to capitalize on the broad-market momentum, hobbled by New Zealand Gross Domestic Product (GDP) figures that broadly missed the mark early Thursday.

New Zealand’s third quarter GDP printed at -0.3%, an unexpected decline compared to the previous quarter’s 0.5% growth (revised down from 0.9%), completely missing the forecast 0.2%. Annualized GDP ended in the third quarter likewise declined, printing at -0.6% versus the expected 0.5% gain, and slipping back from the previous period’s 1.5% (also revised down from 1.8%).

A swamped GDP print has swamped the Kiwi, leaving the NZD as one of the worst performers of the major currency bloc, second only to the US Dollar.

The Business NZ Purchasing Managers’ Index (PMI) for November, due early in the Friday Asia market session, is unlikely to provide much hope for Kiwi bidders. NZ PMI last printed at 42.5 in October.

US S&P Global PMIs are expected to tick down slightly in Friday’s upcoming American session, which could provide additional support for risk pairs and extend downside pressure on the Greenback. December’s Preliminary Manufacturing PMI is forecast to tick down from 49.4 to 49.3.

NZD/USD Technical Outlook

The NZD/USD is waffling on the intraday charts, strung along the 0.6200 handle as the 50-hour Simple Moving Average (SMA) climbs into 0.6170 following a bullish cross of the 200-hour SMA at 0.6150.

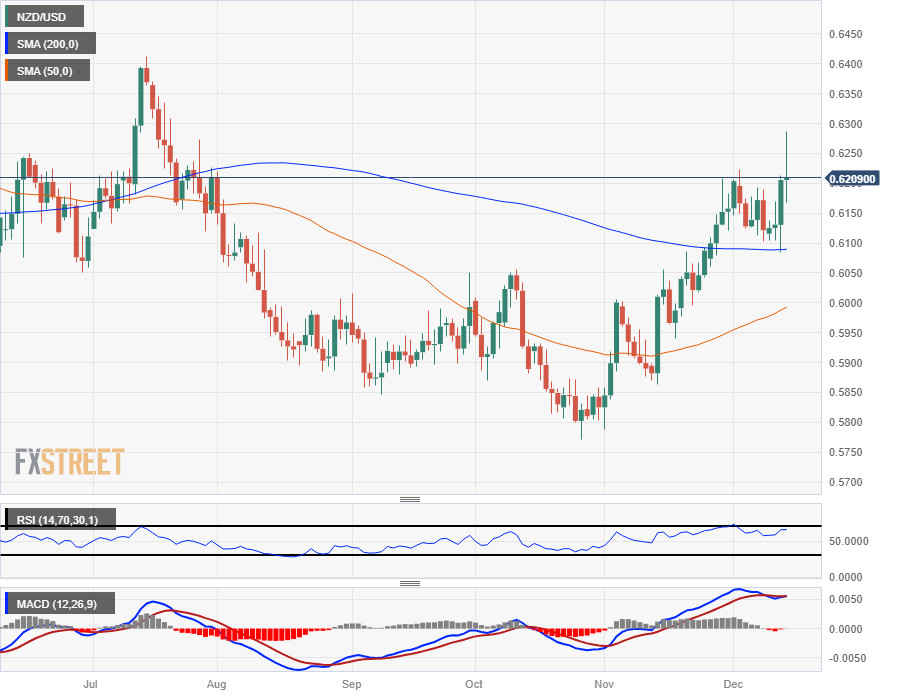
Near-term momentum still leans in favor of NZD/USD bidders with the pair up over seven and a half percent from October’s bottom bids near 0.5770, but evaporating bullish momentum leaves the pair set to consolidate just above the 200-day SMA near 0.6100.

NZD/USD Hourly Chart
NZD/USD Daily Chart
NZD/USD Technical Levels

NZD/USD

Overview
Today last price0.6207
Today Daily Change0.0001
Today Daily Change %0.02
Today daily open0.6206
 
Trends
Daily SMA200.6106
Daily SMA500.5988
Daily SMA1000.5979
Daily SMA2000.6088
 
Levels
Previous Daily High0.6213
Previous Daily Low0.6084
Previous Weekly High0.6223
Previous Weekly Low0.6103
Previous Monthly High0.6208
Previous Monthly Low0.5788
Daily Fibonacci 38.2%0.6164
Daily Fibonacci 61.8%0.6133
Daily Pivot Point S10.6122
Daily Pivot Point S20.6039
Daily Pivot Point S30.5993
Daily Pivot Point R10.6251
Daily Pivot Point R20.6296
Daily Pivot Point R30.638

Author

Joshua Gibson

Joshua joins the FXStreet team as an Economics and Finance double major from Vancouver Island University with twelve years' experience as an independent trader focusing on technical analysis.


More from Joshua Gibson
Share:

Editor's Picks

AUD/USD holds firm near 0.7000 after Chinese inflation, trade data

AUD/USD stays firm near 0.7000 in Wednesday’s Asian session, picking up some bids after China's mixed inflation and upbeat trade data. CPI rose less than expected in September, while PPI inflation picked up. Meanwhile, the Chinese trade surplus unexpectedly widened in September. The pair remains underpinned by a broadly subdued US Dollar, despite the Middle East escalation, as focus remains on US CPI data.

USD/JPY consolidates near 158.50; looks to US CPI for fresh impetus

USD/JPY stays range-bound near 158.50 in the Asian session on Wednesday, with looming intervention risks supporting the Japanese Yen and capping upside amid a softer US Dollar. However, geopolitical uncertainties act as a tailwind for the safe-haven USD and the pair. Traders also seem hesitant ahead of the release of the latest US inflation figures.

Gold nears $4,100 after hot US inflation

Gold extends losses in the American session on Wednesday, following the release of hotter-than-anticipated US CPI. The CPI figure shows that September inflation rose 3.7% YoY, boosting demand for the US Dollar.

XRP recovery faces headwinds despite Ripple and Meritz Securities' tokenization push in Korea

XRP trades above $1.36 as bulls gather momentum to face a critical supply range toward $1.40. Ripple and Meritz Securities partner to explore institutional custody and tokenization services for South Korea’s capital markets.

US CPI data expected to rise in September as markets reassess Fed rate outlook

The US Bureau of Labor Statistics will publish the September Consumer Price Index (CPI) data on Wednesday. The report is expected to show a further increase in headline prices and a small uptick in annual core inflation. Any divergence from analysts’ estimates could influence the Federal Reserve’s policy outlook and impact the US Dollar’s valuation.

Has Bitcoin really escaped the macro forces it was built to fight?
Over 17 years ago, Satoshi Nakamoto designed Bitcoin (BTC) on the back of a global financial crisis as an alternative to the global monetary system outside the control of central banks, governments and traditional intermediaries. This raises a key question: has Bitcoin really become independent of the macroeconomic forces it was built to challenge?