HIMS has build an inverse head and shoulders — The neckline is being tests, the target is $50

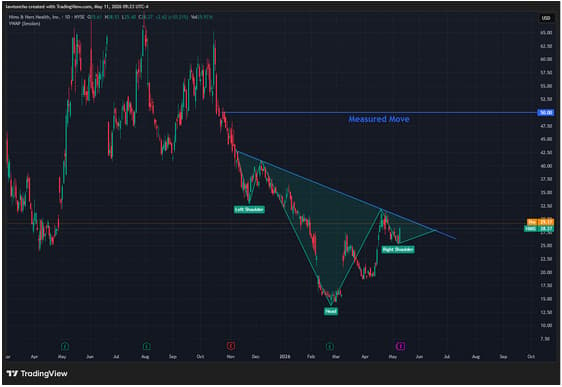
Hims & Hers Health (HIMS) is pressing directly into the neckline of an inverse head and shoulders pattern at $28.27 — a pattern that has been building since November 2025 and carries a measured move target of exactly $50.
The structure is clean. The left shoulder formed near $33–$35 in late November and early December 2025 before the next leg lower. The head pushed down to lows near $13–$14 in late January and early February 2026, representing the deepest point of the entire decline. The right shoulder formed near $19–$20 in late March and early April, a higher low relative to the head that confirmed the buyers were stepping in at a higher price.
It’s classic technical analysis. That sequence — left shoulder, deeper head, higher right shoulder — is exactly what you want to see in a valid inverse head and shoulders.
The neckline connecting the two peaks of this pattern is downsloping, running from approximately $42 in December 2025 down to the current area near $28–$29. Price is sitting on it right now at $28.27.
The pattern hasn't triggered yet. A downsloping neckline requires a confirmed daily close above it. Not an intraday push, not a pre-market print. The actual close is what matters. Today's session has pushed price directly into the neckline zone, which means the next few closes are going to define whether this setup activates or resets.
Also worth noting that HIMS reports earnings for the first quarter of 2026 today. The added volatility that comes with the earnings print is something to keep an eye on during the session.
If the daily close above the neckline comes with real volume behind it, there are two valid entries. The more aggressive approach is to enter on that confirmed close, with a stop defined below the neckline. I'd put that invalidation somewhere in the $25.50–$26.00 range. A daily close back below that level means the breakout is failing and the pattern needs another attempt.
The entry I prefer is to wait for the retrace. After a downsloping neckline breaks, price often pulls back to test it from above before continuing higher. A retrace back toward the $28–$29 zone gives you a tighter long entry with a cleaner stop just below the broken neckline.
The measured move on this pattern projects to $50.00. That's calculated by taking the distance from the head (~$13–$14) to the neckline at its peak (~$35) — approximately $21 — and projecting that same distance above the neckline's origin. The fact that $50 is also a major psychological level adds a second layer of significance to that target. Round numbers attract attention, and when the pattern math and the psychology land on the same price, the target carries more weight than either would alone.
The setup activates on a confirmed daily close above the neckline. Until that happens, it's a pattern in progress — not a trade.
Author

Lawton Ho
Verified Investing
A marketing expert sharing his journey to mastering the charts.
















