Gold trades choppy as Trump’s Iran ultimatum weighs on market sentiment
- old trades broadly stable below $4,700 as uncertainty over a potential deal between US and Iran keeps market sentiment cautious.
- Traders stay on the sidelines ahead of Trump’s 20:00 ET deadline for Iran to open the Strait of Hormuz.
- XAU/USD forms a bearish flag on the 4-hour chart, with downside risks building below the 100-period SMA.

Gold (XAU/USD) is trading in a choppy range on Tuesday with markets on edge as the ultimatum from US President Donald Trump to reach a deal with Iran nears its deadline. At the time of writing, XAU/USD is trading around $4,658, with price action lacking clear direction, as traders look for headlines on a potential deal to reach a truce as the deadline quickly approaches.
Traders stay cautious ahead of Trump’s deadline on Iran
Traders are staying on the sidelines ahead of a key deadline later today set by US President Donald Trump, who warned Iran to “make a deal or open up the Strait of Hormuz” by 8:00 p.m. Eastern Time (00:00 GMT on Wednesday). Trump has threatened to target Iran’s energy and civilian infrastructure if no agreement is reached.
Trump also issued a fresh warning in a Truth Social post, saying, “A whole civilization will die tonight, never to be brought back again. I don’t want that to happen, but it probably will.”
The Islamic Republic News Agency (IRNA) reported on Monday that Tehran rejected a ceasefire proposal conveyed through Pakistan, instead presenting a 10-point plan that includes a permanent end to the war, lifting sanctions, and a formal framework to ensure safe passage through the Strait of Hormuz.
Despite the heightened geopolitical risks, Gold has struggled to attract sustained safe-haven demand. This is partly because the US Dollar (USD) remains firm, as global liquidity demand continues to outweigh traditional flows into bullion.
Elevated Oil prices force markets to scale back Fed rate cut bets
Another factor weighing on Gold is rising Oil prices, which are adding to inflation concerns and increasing risks to economic growth. This is strengthening expectations that major central banks, especially the Federal Reserve (Fed), will keep interest rates higher for longer.
This is likely to show in US inflation data for March due later this week, with economists expecting the Consumer Price Index (CPI) to rise 0.9% MoM, up from 0.3% in February, while annual inflation is seen accelerating to 3.3% from 2.4%.
Markets have largely priced out rate cuts for this year, compared to earlier expectations of at least two cuts, which remains a headwind for the non-yielding metal.
Strong central bank buying keeps Gold’s broader outlook intact
Despite near-term weakness, Gold’s broader outlook remains tilted to the upside. Structural demand continues to support prices, driven by steady central bank purchases, rising sovereign debt levels across major economies, and resilient retail investment demand through exchange-traded funds (ETFs).
According to Bloomberg, China’s central bank added about 160,000 troy ounces, or roughly 5 tons, of Gold in March. This marks the 17th straight month of purchases. In addition, global central banks bought a net 25 tons in the first two months of the year, based on estimates from the World Gold Council (WGC).
Technical analysis: XAU/USD forms a bearish flag on the 4-hour chart
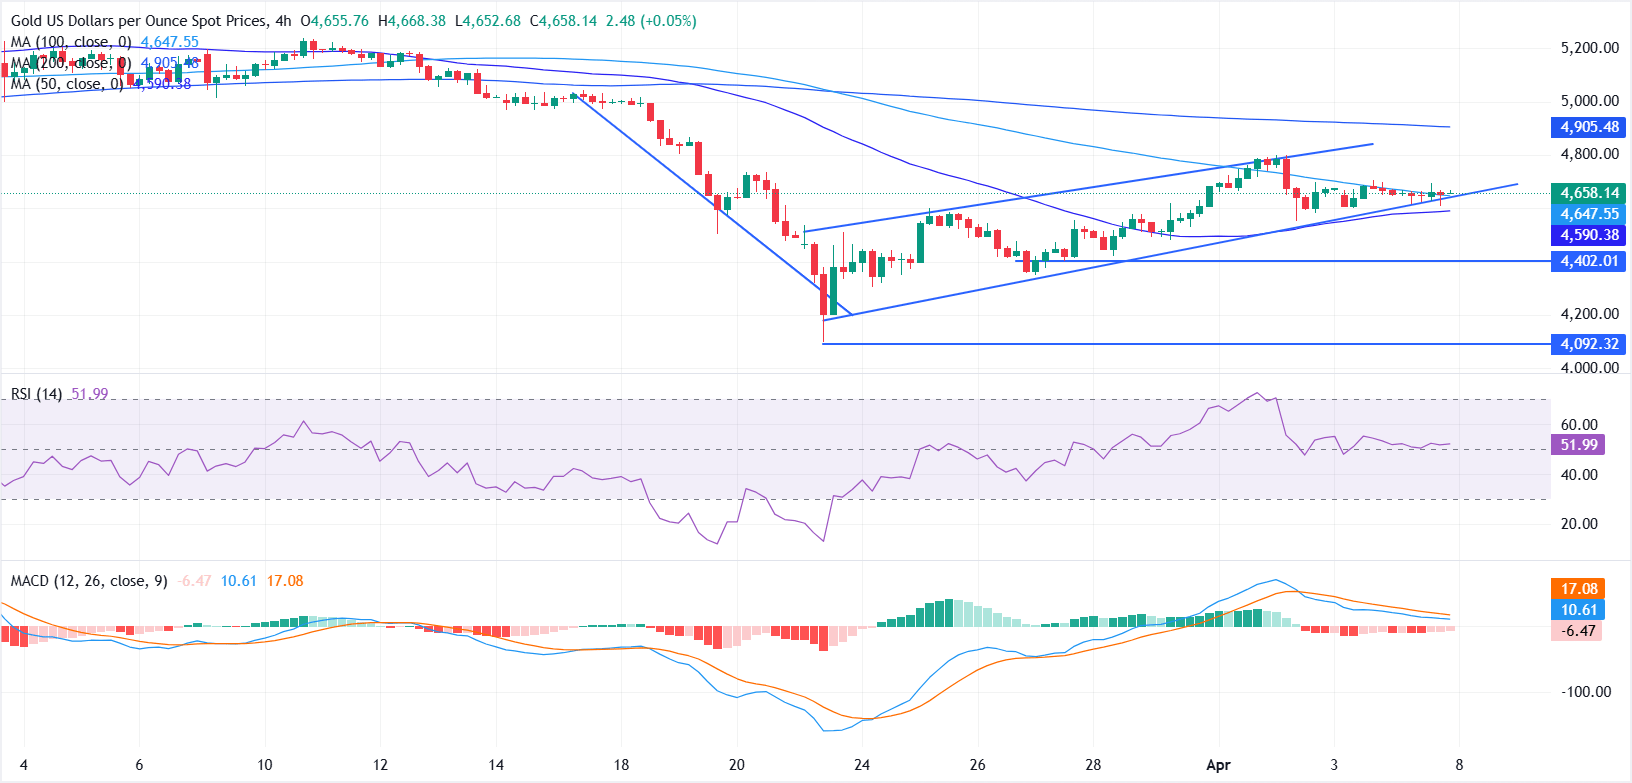
From a technical perspective, the 4-hour chart shows XAU/USD forming a bearish flag pattern, with downside risks mounting as prices press against the lower boundary of the pattern.
The 100-period Simple Moving Average (SMA) near $4,654 continues to act as overhead resistance, with repeated rejections limiting upside attempts. A sustained break above this level could open the door for a move toward the 200-period SMA near $4,908.
On the downside, the 50-period SMA around $4,585 is providing some cushion, though a sustained break below this level could open the door for deeper losses toward the $4,400 region, with further downside risk extending to $4,100.
Momentum indicators remain mixed, with the Relative Strength Index (RSI) hovering near the 50 mark, indicating a lack of strong directional bias. Meanwhile, the Moving Average Convergence Divergence (MACD) histogram remains negative, with the MACD line below its signal line and close to the zero line, suggesting subdued downside pressure rather than strong selling momentum.
Gold FAQs
Gold has played a key role in human’s history as it has been widely used as a store of value and medium of exchange. Currently, apart from its shine and usage for jewelry, the precious metal is widely seen as a safe-haven asset, meaning that it is considered a good investment during turbulent times. Gold is also widely seen as a hedge against inflation and against depreciating currencies as it doesn’t rely on any specific issuer or government.
Central banks are the biggest Gold holders. In their aim to support their currencies in turbulent times, central banks tend to diversify their reserves and buy Gold to improve the perceived strength of the economy and the currency. High Gold reserves can be a source of trust for a country’s solvency. Central banks added 1,136 tonnes of Gold worth around $70 billion to their reserves in 2022, according to data from the World Gold Council. This is the highest yearly purchase since records began. Central banks from emerging economies such as China, India and Turkey are quickly increasing their Gold reserves.
Gold has an inverse correlation with the US Dollar and US Treasuries, which are both major reserve and safe-haven assets. When the Dollar depreciates, Gold tends to rise, enabling investors and central banks to diversify their assets in turbulent times. Gold is also inversely correlated with risk assets. A rally in the stock market tends to weaken Gold price, while sell-offs in riskier markets tend to favor the precious metal.
The price can move due to a wide range of factors. Geopolitical instability or fears of a deep recession can quickly make Gold price escalate due to its safe-haven status. As a yield-less asset, Gold tends to rise with lower interest rates, while higher cost of money usually weighs down on the yellow metal. Still, most moves depend on how the US Dollar (USD) behaves as the asset is priced in dollars (XAU/USD). A strong Dollar tends to keep the price of Gold controlled, whereas a weaker Dollar is likely to push Gold prices up.
Author

Vishal Chaturvedi
FXStreet
I am a macro-focused research analyst with over four years of experience covering forex and commodities market. I enjoy breaking down complex economic trends and turning them into clear, actionable insights that help traders stay ahead of the curve.

















