Gold holds near seven-week high as markets await Strait of Hormuz deal
- Gold pauses after reaching a seven-week high as traders monitor developments surrounding the Strait of Hormuz.
- Markets lower expectations of a September Fed rate hike ahead of Friday’s Nonfarm Payrolls report.
- Momentum indicators turn bullish as XAU/USD reclaims the 50-day SMA.

Gold (XAU/USD) consolidates gains on Thursday after briefly climbing above $4,300 as the US Dollar (USD) steadies while traders await confirmation of a possible Iran-Oman agreement on the Strait of Hormuz. At the time of writing, XAU/USD trades around $4,269, up 0.52% on the day.
The precious metal rallied a little over 4% on Wednesday, hitting its highest level in seven weeks after Iran said it had reached an understanding with Oman on a proposed shipping route through the Strait. Tehran added that a joint statement containing the main points of the agreement was in the final stages of drafting.
Oil prices stay under pressure, creating a supportive backdrop for Bullion. A sustained decline in energy prices would ease inflation concerns and reduce pressure on major central banks, particularly the Federal Reserve (Fed), to raise interest rates. Higher borrowing costs generally weigh on Gold by increasing the opportunity cost of holding the non-yielding metal.
Despite the recent decline, Oil prices still carry a significant geopolitical risk premium as tensions in the Middle East persist. Iran says the proposed agreement with Oman would establish only a temporary shipping route and would not amount to a full reopening of the Strait. Yemen’s Houthis also claim to have attacked two Saudi oil tankers, while Tehran denies holding talks with the United States, saying its discussions with Oman are strictly bilateral.
Still, lower energy prices and softer US labour-market data, including weaker ADP employment and JOLTS figures, have prompted traders to reduce bets on a September Fed rate hike. Initial Jobless Claims, however, rose only slightly to 199K from 198K and came in below the 202K forecast.
According to the CME FedWatch Tool, markets now see a 56.9% chance of a 25-basis-point (bps) increase in September, down from 63.4% a week earlier.
Attention now turns to Friday’s US Nonfarm Payrolls (NFP) report. According to TD Securities, July ADP employment data "surprised to the downside, moderating to 44k (TD: 50k, cons: 65k)." Analysts highlight that "both the monthly and weekly ADP data have moderated this summer after a strong start to the year," and they anticipate that "a similar trend is likely to occur with NFP job gains."
Technical analysis: Buyers regain control above 50-day SMA, $4,300 in focus
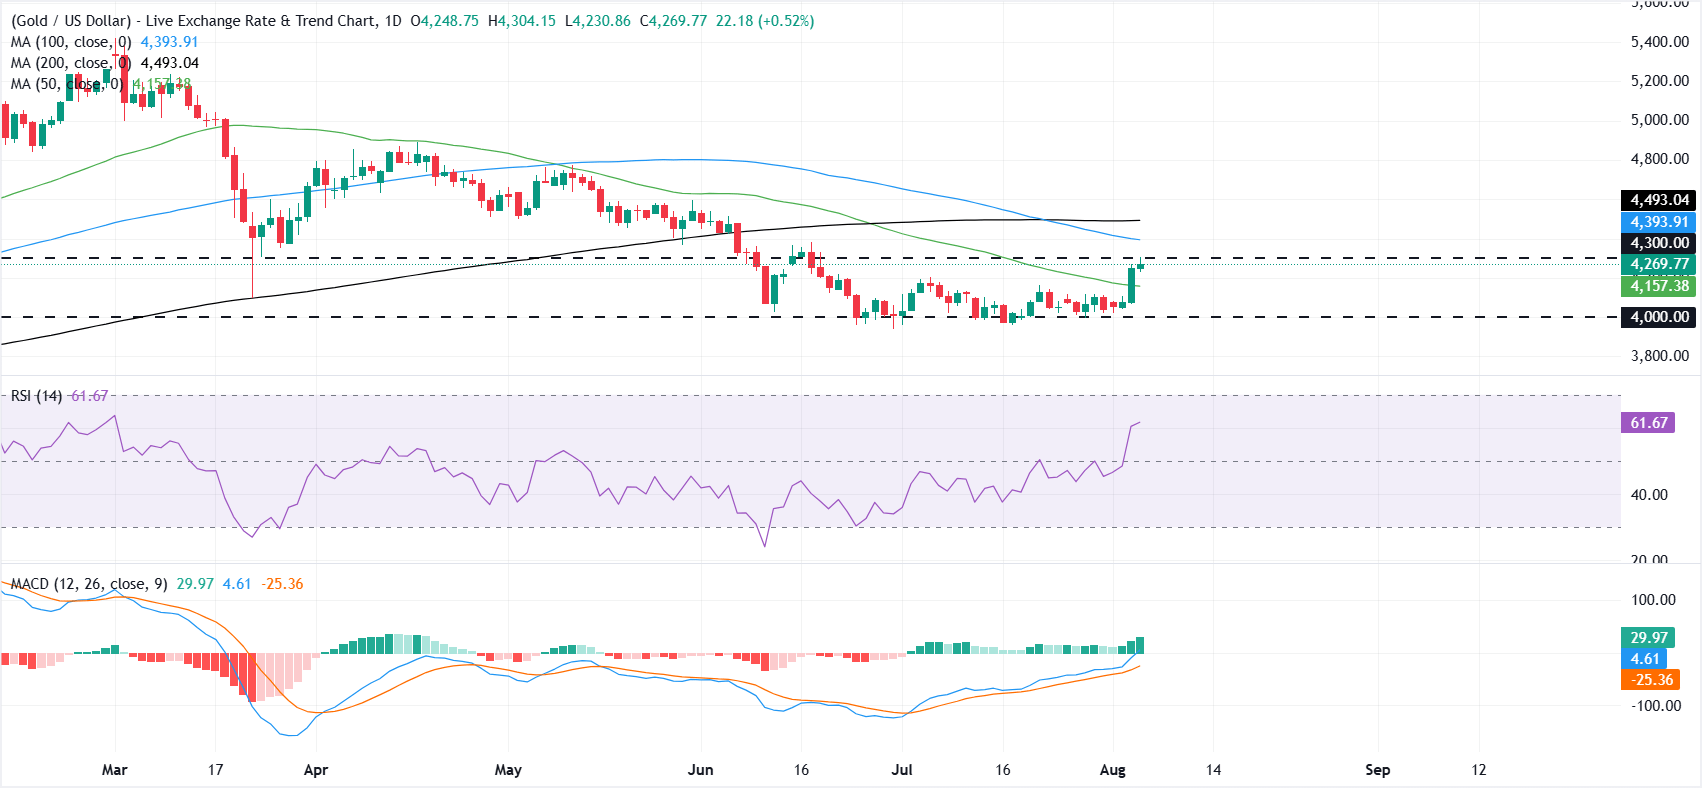
XAU/USD is recovering above the 50-day Simple Moving Average (SMA) at $4,157, but remains capped beneath the 100- and 200-day SMAs, keeping the broader tone neutral with a slight topside constraint.
The Relative Strength Index (RSI) at 61 on the daily chart leans toward bullish momentum, while the Moving Average Convergence Divergence (MACD) indicator holds in positive territory with the line above the signal and an expanding positive histogram, which together suggest improving upside pressure despite the overhead moving-average barrier.
On the topside, initial resistance is seen at the horizontal level around $4,300, ahead of the 100-day SMA at $4,393, with the 200-day SMA at $4,493 acting as a more distant cap.
On the downside, immediate support is provided by the reclaimed 50-day SMA near $4,157, with a deeper structural floor at the prior horizontal support around $4,000, where buyers would be expected to re-emerge if a pullback develops.
(The technical analysis of this story was written with the help of an AI tool. Know more.)
US Dollar Price Today
The table below shows the percentage change of US Dollar (USD) against listed major currencies today. US Dollar was the strongest against the Swiss Franc.
| USD | EUR | GBP | JPY | CAD | AUD | NZD | CHF | |
|---|---|---|---|---|---|---|---|---|
| USD | 0.08% | 0.03% | 0.11% | -0.11% | 0.25% | 0.12% | 0.31% | |
| EUR | -0.08% | -0.06% | 0.04% | -0.18% | 0.13% | 0.05% | 0.23% | |
| GBP | -0.03% | 0.06% | 0.09% | -0.13% | 0.20% | 0.09% | 0.29% | |
| JPY | -0.11% | -0.04% | -0.09% | -0.22% | 0.13% | 0.02% | 0.22% | |
| CAD | 0.11% | 0.18% | 0.13% | 0.22% | 0.35% | 0.25% | 0.44% | |
| AUD | -0.25% | -0.13% | -0.20% | -0.13% | -0.35% | -0.09% | 0.09% | |
| NZD | -0.12% | -0.05% | -0.09% | -0.02% | -0.25% | 0.09% | 0.22% | |
| CHF | -0.31% | -0.23% | -0.29% | -0.22% | -0.44% | -0.09% | -0.22% |
The heat map shows percentage changes of major currencies against each other. The base currency is picked from the left column, while the quote currency is picked from the top row. For example, if you pick the US Dollar from the left column and move along the horizontal line to the Japanese Yen, the percentage change displayed in the box will represent USD (base)/JPY (quote).
Author

Vishal Chaturvedi
FXStreet
I am a macro-focused research analyst with over four years of experience covering forex and commodities market. I enjoy breaking down complex economic trends and turning them into clear, actionable insights that help traders stay ahead of the curve.














