Gold Price Forecast: XAU/USD hovers near $5,100 non risk-off markets
- Gold rallies beyond $5,000 to hit a fresh record high just below $5,100.
- Geopolitical tensions, trade uncertainty, and fears of a Yen intervention are hammering the US Dollar.
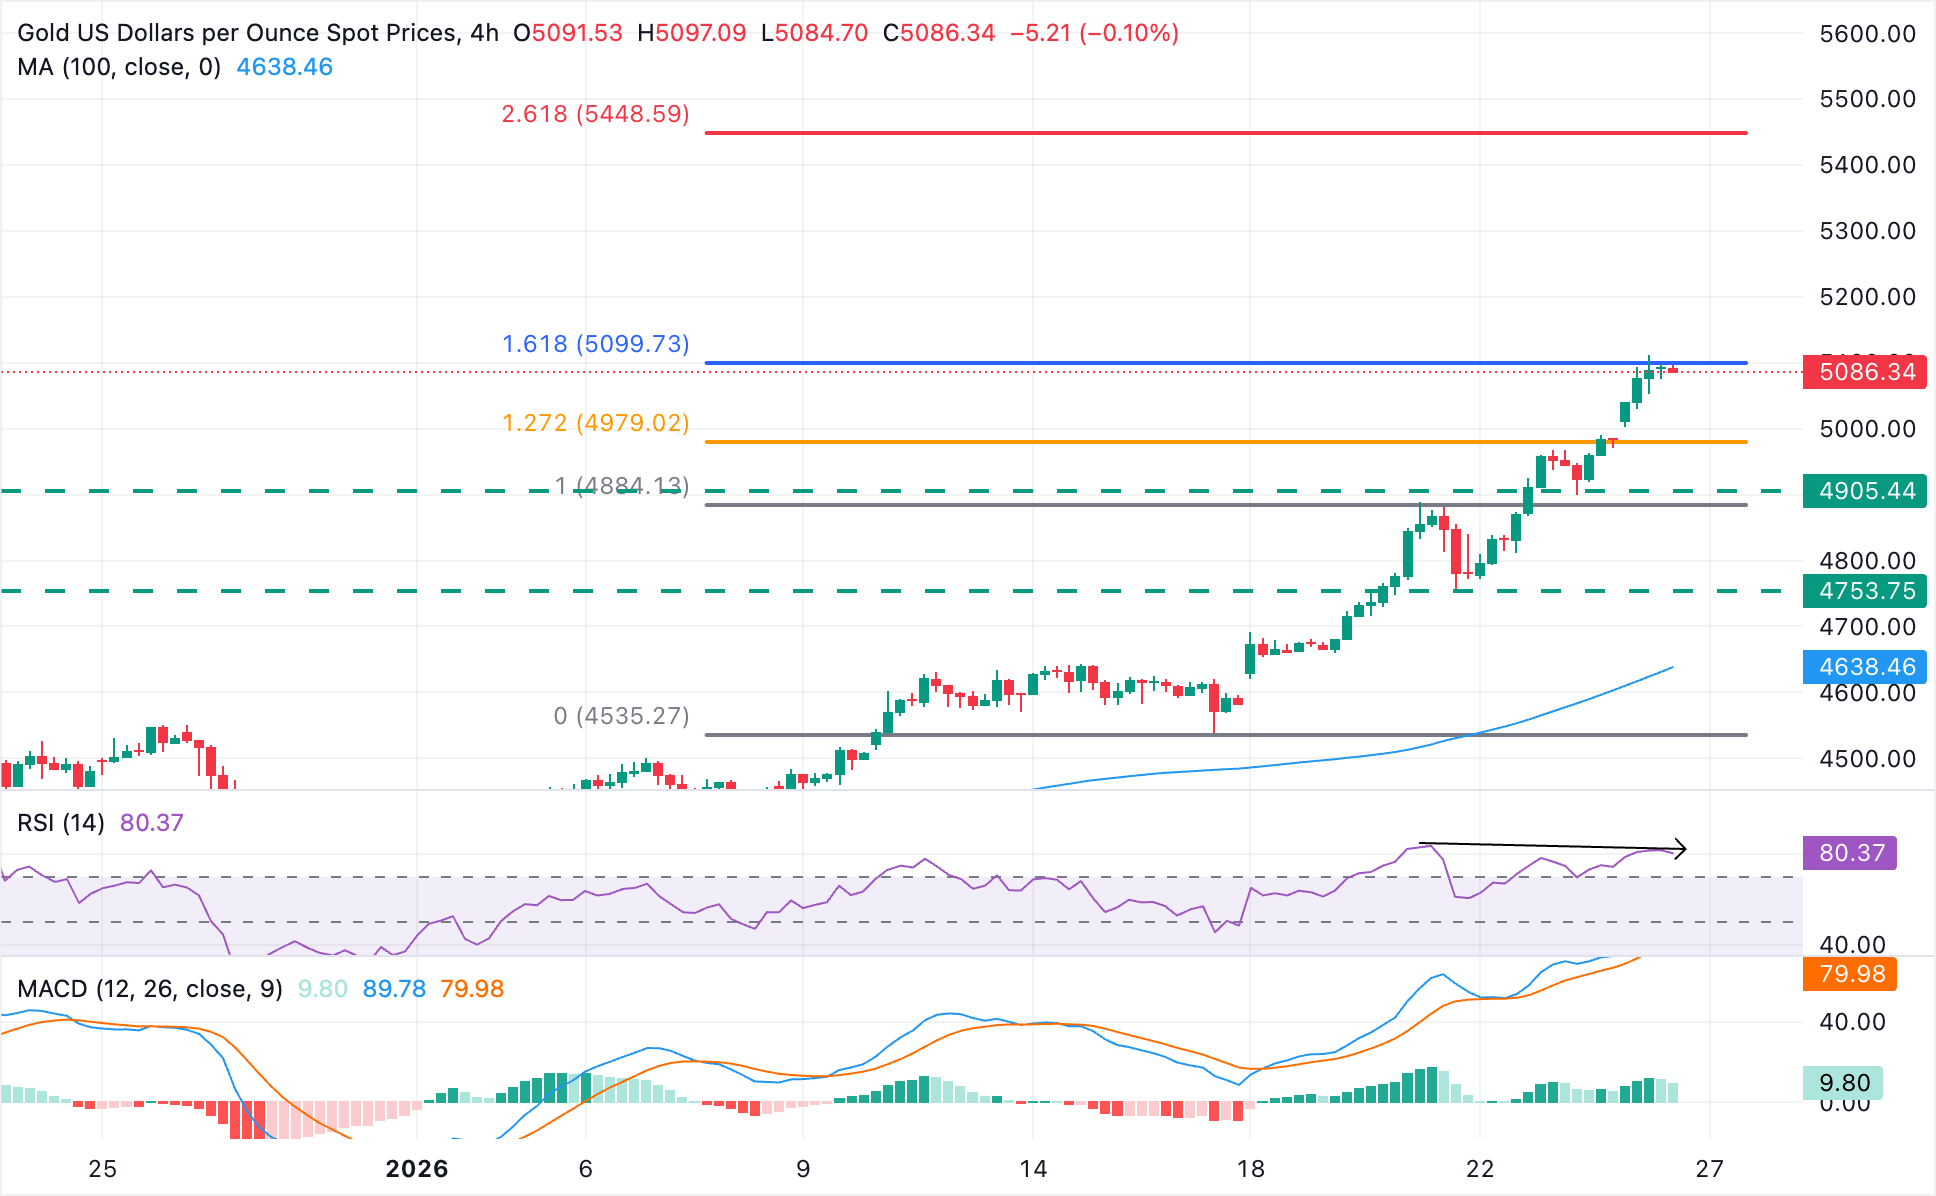
- XAU/USD rally looks overstretched, and the 4-hour RSI shows bearish divergence.

Gold’s (XAU/USD) keeps marching higher on Monday, boosted by a mix of geopolitical tensions, US President Trump’s new tariff salvo, and a weaker US Dollar amid fears of an immediate Yen intervention. Bullion gapped up above the $5,000 psychological level at Monday's session opening, and is testing resistance at $5,100 at the time of writing.
Precious metals surged on Friday as the US Federal Reserve requested US Dollar-Yen quotes by major US banks, boosting market expectations of a joint US-Japan intervention to support the JPY. Apart from that, the escalating tensions between the US and Iran and Trump’s threat to apply 100% tariffs to Canada have triggered a risk-averse reaction, increasing support for safe havens like Gold.
Technical Analysis
XAU/USD trades at $5,092, with bulls contained below the 161.8% Fibonacci extension of the January 16-21 rally, at $5,100. The Moving Average Convergence Divergence (MACD) stays above zero and has risen in recent readings, suggesting strengthening bullish momentum, but the Relative Strength Index (RSI), above 80, highlights an overstretched rally, with recent trend showing a bearish divergence.
Above the mentioned $5,100 level, the next target is the 261.8$ Fibonacci retracement of the same cycle, at $5,450.
The pair has rallied more than 10% over the last six days and is screaming for a correction. It's also worth saying that markets tend to fill trading gaps and, in that sense, a reversal to the $5.000-$4,980 area should be considered. A deeper correction would bring the January 23 low, in the $4,900 area, back to the focus.
(The technical analysis of this story was written with the help of an AI tool.)
US Dollar Price Today
The table below shows the percentage change of US Dollar (USD) against listed major currencies today. US Dollar was the strongest against the Canadian Dollar.
| USD | EUR | GBP | JPY | CAD | AUD | NZD | CHF | |
|---|---|---|---|---|---|---|---|---|
| USD | -0.24% | -0.13% | -1.19% | -0.07% | -0.37% | -0.34% | -0.47% | |
| EUR | 0.24% | 0.10% | -0.95% | 0.17% | -0.12% | -0.11% | -0.23% | |
| GBP | 0.13% | -0.10% | -1.05% | 0.07% | -0.24% | -0.21% | -0.33% | |
| JPY | 1.19% | 0.95% | 1.05% | 1.14% | 0.82% | 0.86% | 0.73% | |
| CAD | 0.07% | -0.17% | -0.07% | -1.14% | -0.31% | -0.27% | -0.40% | |
| AUD | 0.37% | 0.12% | 0.24% | -0.82% | 0.31% | 0.03% | -0.09% | |
| NZD | 0.34% | 0.11% | 0.21% | -0.86% | 0.27% | -0.03% | -0.13% | |
| CHF | 0.47% | 0.23% | 0.33% | -0.73% | 0.40% | 0.09% | 0.13% |
The heat map shows percentage changes of major currencies against each other. The base currency is picked from the left column, while the quote currency is picked from the top row. For example, if you pick the US Dollar from the left column and move along the horizontal line to the Japanese Yen, the percentage change displayed in the box will represent USD (base)/JPY (quote).
Author

Guillermo Alcala
FXStreet
Graduated in Communication Sciences at the Universidad del Pais Vasco and Universiteit van Amsterdam, Guillermo has been working as financial news editor and copywriter in diverse Forex-related firms, like FXStreet and Kantox.














