|

Gold Price Forecast: XAU/USD falls below 20-Day EMA as Gold price surrenders to US bond yields rise

  • Gold price lost its bright as the US 10-year Treasury bond yield recovers lost ground, eyeing 3.45%.
  • US Durable Goods Orders soar in March, surpassing estimates, while Core Orders (excl. transport) edge up.
  • Gold Price Analysis: XAU/USD shows bearish signs as it stays below the 20-day EMA, and RSI accelerates a downtrend.

Gold price retreats after hitting a weekly high of $2009.34, drops as an uptick in US Treasury bond yields weighed on the yellow metal price. Though the XAU/USD dived below the 20-day Exponential Moving Average (EMA), a weak US Dollar (USD) capped its fall. The XAU/USD is trading at $1987, down 0.50%.

Gold price dulls amidst rising US bond yields and bearish XAU/USD signals

OF late, market sentiment shifted sour, as Wall Street’s turned negative, except for the Nasdaq. US economic data revealed in the day, namely Durable Good Orders surprisingly jumped by 3.2% MoM in March, exceeding estimates of 0.7%. Core Durable Good Orders, which exclude Transports, edged up 0.3% MoM, compared to a contraction of -0.2% estimated by the consensus.

Aside from this, US regional bank woes continued to dent investors’ mood, while a bid in US Treasury bond yields undermined appetite for the XAU/USD. The US 10-year Treasury bond yield advances four basis points, at 3.447%, but remains well below the opening week levels of 3.568%.

In the meantime, expectations for a US Federal Reserve (Fed) 25 bps rate hike in May, diminished, with odds at 76.1%, below the previous week’s 83.3% chance.

Regarding US politics, later news, the Republican Debt ceiling bill advanced in the US House of Representatives toward a debate and a possible vote.

Meanwhile, recession fears in the United States increased, as the US Atlanta Fed GDPNow for Q1 stands at 1.1%, versus a previous reading of 2.5%, ahead of the release on Thursday of Advance GDP figures for Q1 2023.
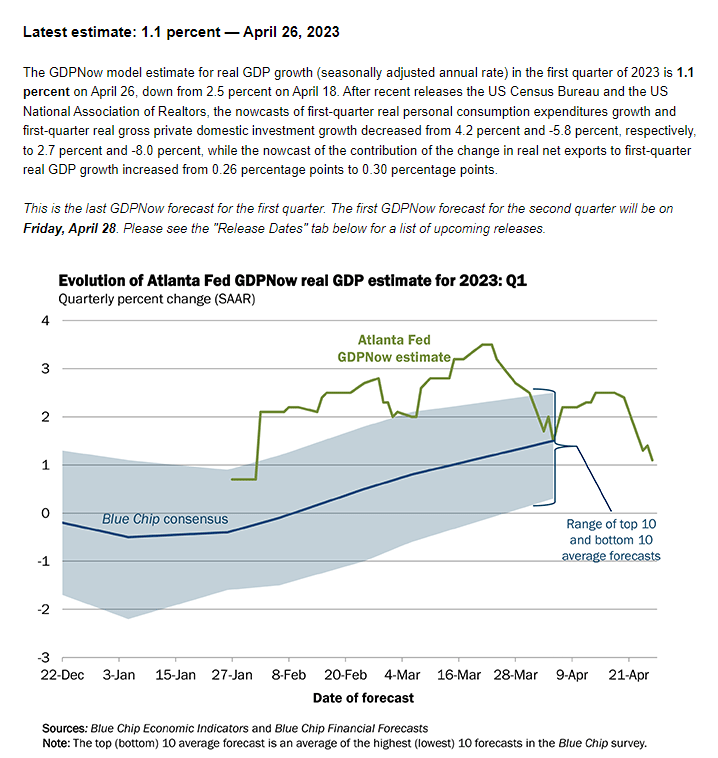
Atlanta GDP Now

Besides that, the US economic agenda will feature Initial Jobless Claims for the latest week, alongside Pending Home Sales and Friday’s release of the Fed’s preferred gauge for inflation, the core PCE.

XAU/USD Technical Analysis
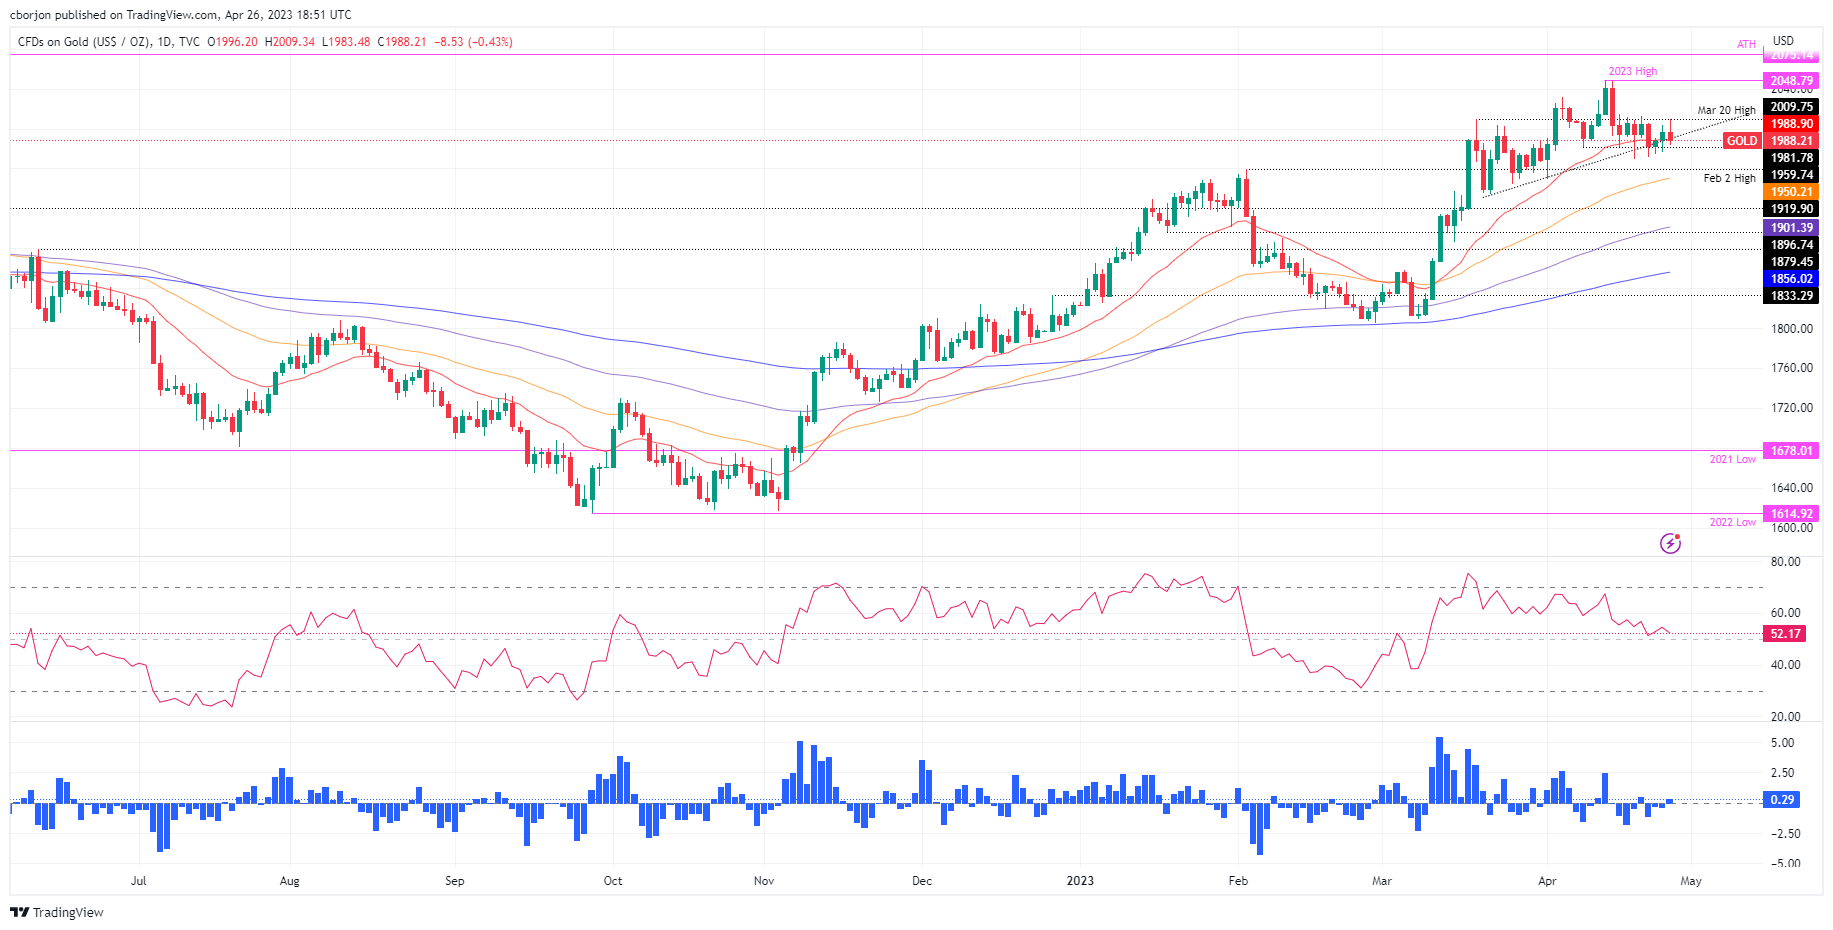
XAU/USD Daily Chart

From a technical perspective, some signs suggest the XAU/USD could test the $1950 area in the near term. Firstly, the XAU/USD stays below the 20-day EMA, which sits at $1988.65, not far from the current price, but a daily close below the former, is a signal of bearishness. Moreover, the Relative Strength Index (RSI) accelerated its downtrend and is about to cross below the 50-mid line. That said, further downward action is warranted.

Hence, the XAU/USD first support would be the latest couple of weeks’ low at $1969.34, followed by the February 2 high at $1959.74, before falling to the confluence of the figure and the 50-day EMA at $1950.

Conversely, if XAU/USD reclaims the 20-day EMA, further sideways action between the $1980-$2000 area is expected.

XAU/USD

Overview
Today last price1986.01
Today Daily Change-11.30
Today Daily Change %-0.57
Today daily open1997.31
 
Trends
Daily SMA201997.28
Daily SMA501925.27
Daily SMA1001891.32
Daily SMA2001803.22
 
Levels
Previous Daily High2003.87
Previous Daily Low1976.21
Previous Weekly High2015.13
Previous Weekly Low1969.26
Previous Monthly High2009.88
Previous Monthly Low1809.46
Daily Fibonacci 38.2%1993.3
Daily Fibonacci 61.8%1986.78
Daily Pivot Point S11981.06
Daily Pivot Point S21964.8
Daily Pivot Point S31953.4
Daily Pivot Point R12008.72
Daily Pivot Point R22020.12
Daily Pivot Point R32036.38

Author

Christian Borjon Valencia

Markets analyst, news editor, and trading instructor with over 14 years of experience across FX, commodities, US equity indices, and global macro markets.


More from Christian Borjon Valencia
Share:

Editor's Picks

AUD/USD remains depressed near 0.6950 after RBA minutes

AUD/USD attracts follow-through selling during Tuesday’s Asian session, looking to extend the overnight rejection slide from 0.7000, or a two-week top, following the release of RBA meeting Minutes. The US Dollar retains a bullish undertone near its highest level since April 2025 as energy-driven inflation risks keep December Fed rate hike bets firmly on the table. Adding to this, geopolitical risks further underpin the safe-haven USD.

USD/JPY extends retreat below 158.50 as intervention risks loom

USD/JPY is dropping below 158.50 in the Asian session on Tuesday, snapping a two-day winning streak and pulling back from an over two-week top touched the previous day, despite Japan's soft PPI inflation print. Bulls turn cautious amid speculation that authorities will step in to prop up the Japanese Yen, which, in turn, weighs on the pair.

Gold bulls seem hesitant below $4,200 as hawkish Fed offset USD weakness

Gold retains a mildly positive bias though it remains capped below the $4,200 mark and the top boundary of a two-week-old trading range. The US Dollar retreats from its highest level since April 2025 amid some profit-taking, offering support to the precious metal. However, the US Federal Reserve's hawkish stance and escalating Middle East conflicts could limit deeper losses for the safe-haven buck, keeping a lid on the commodity and warranting some caution for aggressive bulls.

Solana reclaims 50-day EMA amid tokenization expansion

Solana (SOL) trades above $107 on Tuesday, reclaiming the 50-day EMA after closing below it the previous day. Meanwhile, Solana’s tokenization expansion and the upcoming listing of Hong Kong’s second spot Solana Exchange Traded Fund highlight growing institutional interest.

Dollar corrects as markets watch bank earnings
The US Dollar remains broadly strong but is now correcting, with a possible retest of the breakout zone around 102 on the Dollar Index. Equity markets are showing a mixed picture: the S&P 500 and Nasdaq are weaker, while blue-chip indices such as the Dow Jones and DAX are moving higher.
Has Bitcoin really escaped the macro forces it was built to fight?
Over 17 years ago, Satoshi Nakamoto designed Bitcoin (BTC) on the back of a global financial crisis as an alternative to the global monetary system outside the control of central banks, governments and traditional intermediaries. This raises a key question: has Bitcoin really become independent of the macroeconomic forces it was built to challenge?















