|

Gold Price Analysis: XAU/USD needs to crack $1722 for additional downside, Powell eyed

  • Gold remains pressured as Turkish upheaval keeps the DXY underpinned.
  • Falling Treasury yields slow the decline in XAU/USD ahead of Powell.
  • XAU bears tease rising wedge breakdown on the 4H chart.

Gold (XAU/USD) has stalled its rebound and turns south once again, undermined by broad-based US dollar strength, as markets seek safety in the greenback amid fears of overheating and Turkey’s abrupt sacking of the central bank Chief.

Although the XAU buyers remain hopeful amid falling US Treasury yields, which make the non-yielding gold relatively attractive. The benchmark US 10-year rates shed 3.30% so far, back under the 1.70% level.  

Gold’s fate hinges on the Fed Chair Jerome Powell’s speech due later in the session ahead. However, the bright metal risks further falls if the risk-aversion deepens in European trading and refuels the haven demand for the buck.

From a near-term technical perspective, gold is on the verge of confirming a rising wedge breakdown if the price closes the four-hour candlestick below the $1737 support.

Gold Price Chart: Four-hour
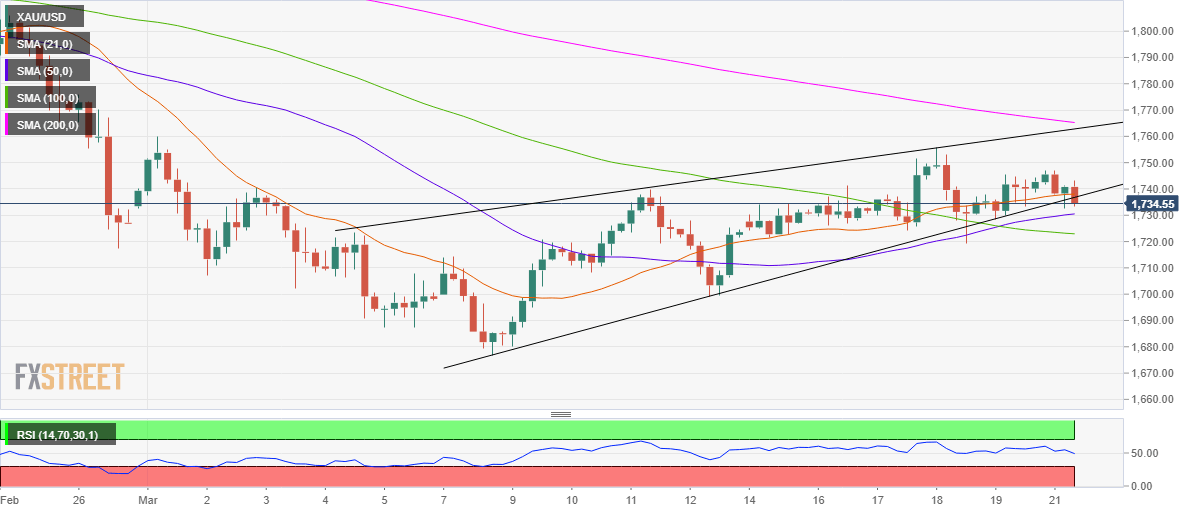
The bears will then test the bullish 50-simple moving average (SMA) at $1730, below which the 100-SMA at $1722 could be challenged.

Acceptance below the latter is needed to extend the downside towards the previous month low of $1717.  

The Relative Strength Index (RSI) points south while trading currently at 48.99, suggesting that the spot is poised for more losses.

On the flip side, if the 100-SMA support holds, a move back towards the pattern support now resistance at $1737 would not be ruled.

Further up, the daily high of $1747 could be next on the buyers’ radar, as they eye a sustained break above the $1750 psychological level.

Gold: Additional levels

XAU/USD

Overview
Today last price1732.32
Today Daily Change-13.18
Today Daily Change %-0.76
Today daily open1745.5
 
Trends
Daily SMA201736.99
Daily SMA501793.99
Daily SMA1001831.46
Daily SMA2001860.55
 
Levels
Previous Daily High1746.86
Previous Daily Low1728.56
Previous Weekly High1755.59
Previous Weekly Low1719.3
Previous Monthly High1871.9
Previous Monthly Low1717.24
Daily Fibonacci 38.2%1739.87
Daily Fibonacci 61.8%1735.55
Daily Pivot Point S11733.75
Daily Pivot Point S21722.01
Daily Pivot Point S31715.45
Daily Pivot Point R11752.05
Daily Pivot Point R21758.61
Daily Pivot Point R31770.35

Author

Dhwani Mehta

Dhwani Mehta

FXStreet

Residing in Mumbai (India), Dhwani is a Senior Analyst and Manager of the Asian session at FXStreet. She has over 10 years of experience in analyzing and covering the global financial markets, with specialization in Forex and commodities markets.


More from Dhwani Mehta
Share:

Editor's Picks

GBP/USD ranges below 1.3450 amid US-Iran uncertainty, ahead of US data

GBP/USD keeps its range below 1.3450 in the European session on Tuesday. Uncertainty surrounding US-Iran talks drives traders toward a safe-haven currency such as the US Dollar, while undermining the risk-sensitive British Pound. All eyes remain on the US JOLTS data and Mideast headlines.

EUR/USD flatlines above 1.1500, awaits US jobs data

EUR/USD holds steady around 1.1505 in European trading hours on Tuesday. Markets remain cautious ahead of a slew of US jobs data, starting with the JOLTS Job Openings Survey later today. However, the downside appears capped by hot Eurozone inflation in July, bolstering the case for a European Central Bank rate hike at the next meeting.

Gold consolidates above $4,050 amid Fed hike bets and Iran uncertainty

Gold seesaws between tepid gains and minor losses during the Asian session as traders seem hesitant and opt to wait for further developments surrounding the Middle East crisis. The US Dollar struggles to build on the previous day's solid bounce from the lowest level since Mid-June and acts as a tailwind for the bullion. However, the uncertainty over US-Iran peace talks helps limit the downside for the buck.

Ripple and Stellar steady as derivatives data points to easing downside pressure

Ripple and Stellar show mixed price action, with XRP holding above the key $1 support zone while XLM faces rejection at $0.173. Meanwhile, improving derivatives metrics alongside fading bearish momentum suggest that the downside pressure may be easing for both altcoins. Derivatives data shows mild bullish sentiment among traders.

US JOLTs report in focus
In the US, the June JOLTs report will be in the spotlight. Job openings have increased modestly this year, which has historically predicted rising wage cost pressures ahead. June trade balance data will also be released in the afternoon and the preliminary reading pointed towards a stable trade deficit from May. The Fed's Schmid (non-voter, hawk) will be on the wires overnight.
9-3: Is the Federal Reserve’s vote tally Warsh's new forward guidance?
The rate did not move. Neither did the statement, and that’s the more interesting fact. Set the July 29 Federal Open Market Committee (FOMC) statement beside the one issued on June 17, and the two documents are identical apart from a single verb and a paragraph at the bottom naming three dissenters.