Gold Price Analysis: XAU/USD eyes $1770 amid symmetrical triangle breakdown
- XAU/USD spots symmetrical triangle breakdown on the 1H chart.
- RSI point south, within the bearish zone, allowing more declines.
- Downside more compelling amid a bunch of healthy resistance levels.

Gold (XAU/USD) eyes deeper losses, as the rally in the US Treasury yields picks up pace in European trading.
Despite closing Wednesday above the $1800 level, the bears retain control amid a technical break to the downside on the hourly chart.
The price of Gold confirmed a symmetrical triangle breakdown on the said timeframe after delivering an hourly close below the rising trendline support at $1796.
The bearish break calls for a retest of Wednesday’s low at $1784, below which the measured target at $1770 could be challenged.
The downside bias also got additional credence after the price breached the critical cushion around $1798, where the 200, 100 and 21-hourly moving averages (HMA) converge.
Gold Price Chart: Hourly
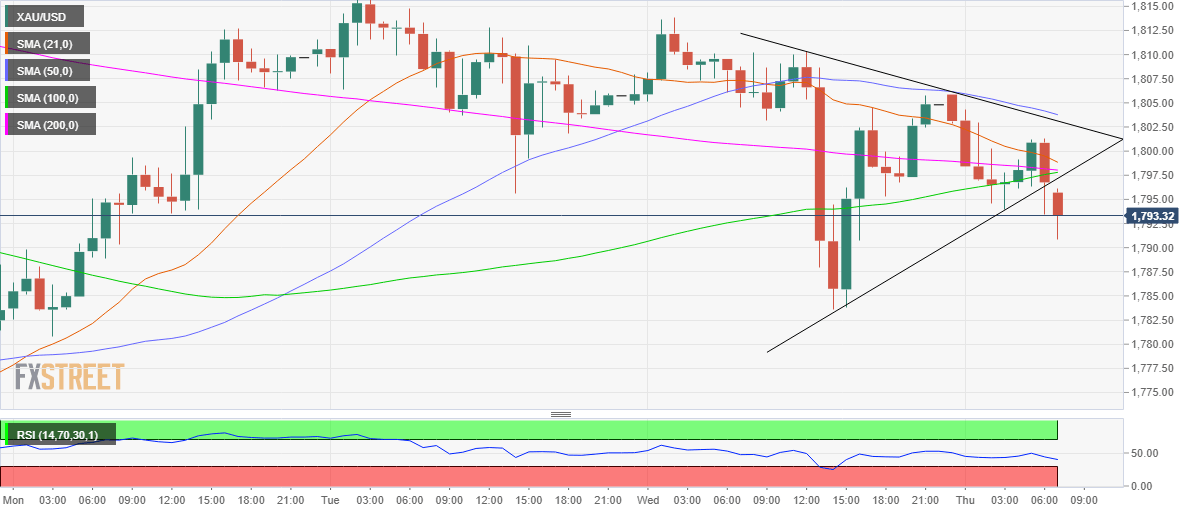
On the flip side, any pullbacks could meet stiff resistance at the aforementioned fierce support now upside barrier at $1797/98.
Further up, the $1800 level could be probed. The intersection of the 50-HMA, pattern resistance and the previous month low at $1803 would be a tough nut to crack for the XAU bulls.
Gold Additional levels
Author

Dhwani Mehta
FXStreet
Residing in Mumbai (India), Dhwani is a Senior Analyst and Manager of the Asian session at FXStreet. She has over 10 years of experience in analyzing and covering the global financial markets, with specialization in Forex and commodities markets.

















