Gold eases from two-week highs as Oil rebounds on Hormuz tensions
- Gold slips as geopolitical tensions around the Strait of Hormuz keep Oil prices elevated.
- Softer Oil prices and a weaker US Dollar support XAU/USD, while easing yields add to bullish momentum.
- XAU/USD keeps a mildly bullish tone above the $4,500 support zone, though upside remains capped below key daily moving averages.

Gold (XAU/USD) trims some of its earlier gains on Thursday as the US Dollar and Oil prices rebound amid persistent tensions surrounding the Strait of Hormuz. At the time of writing, XAU/USD is trading around $4,712 after touching a two-week high near $4,764 earlier in the day.
Iran has imposed new rules for vessels passing through the Strait of Hormuz, according to CNN, in an attempt to tighten control over shipping movements through the waterway, which handles 20% of global Oil flows. Commercial ships are reportedly required to coordinate transit with Iranian military authorities. It remains unclear whether transit fees will be imposed, though earlier reports suggested fees of about $2 million for passage.
However, markets remain cautiously optimistic that a deal to end the war in the Middle East could eventually be reached, with Tehran reviewing the latest US-backed proposal. Speaking to reporters at the White House on Wednesday, US President Donald Trump said, “We’ve had very good talks over the last 24 hours, and it’s very possible that we’ll make a deal.”
On the monetary policy front, Federal Reserve (Fed) officials remain in no rush to resume monetary policy easing. Boston Fed President Susan Collins said on Thursday that interest rates may need to remain on hold “for a longer period” while warning that “the odds of a worse inflation scenario have increased.” Collins added that an alternative scenario could make the Fed consider “a rate hike,” though she still expects interest rate cuts “down the road.”
The upside in Gold appears limited as higher-for-longer interest rate expectations and uncertainty surrounding the US-Iran peace negotiations persist. Previous peace talks and proposals between Washington and Tehran have failed to produce a breakthrough amid differences over Iran’s nuclear program. Trump has threatened to resume bombardment if the talks collapse.
Beyond geopolitical developments, investor attention also remains on the latest US labor market data. Initial Jobless Claims rose to 200K in the week ending May 2, above the previous week’s 190K reading but slightly below market expectations of 205K.
The US ADP Employment Change report released on Wednesday showed private sector payrolls increased by 109K in April, up from 61K in March and above market expectations of 99K. Traders now await the Nonfarm Payrolls (NFP) report on Friday for fresh clues on the Fed’s monetary policy path.
Technical Analysis: XAU/USD rebounds, but key moving averages limit upside
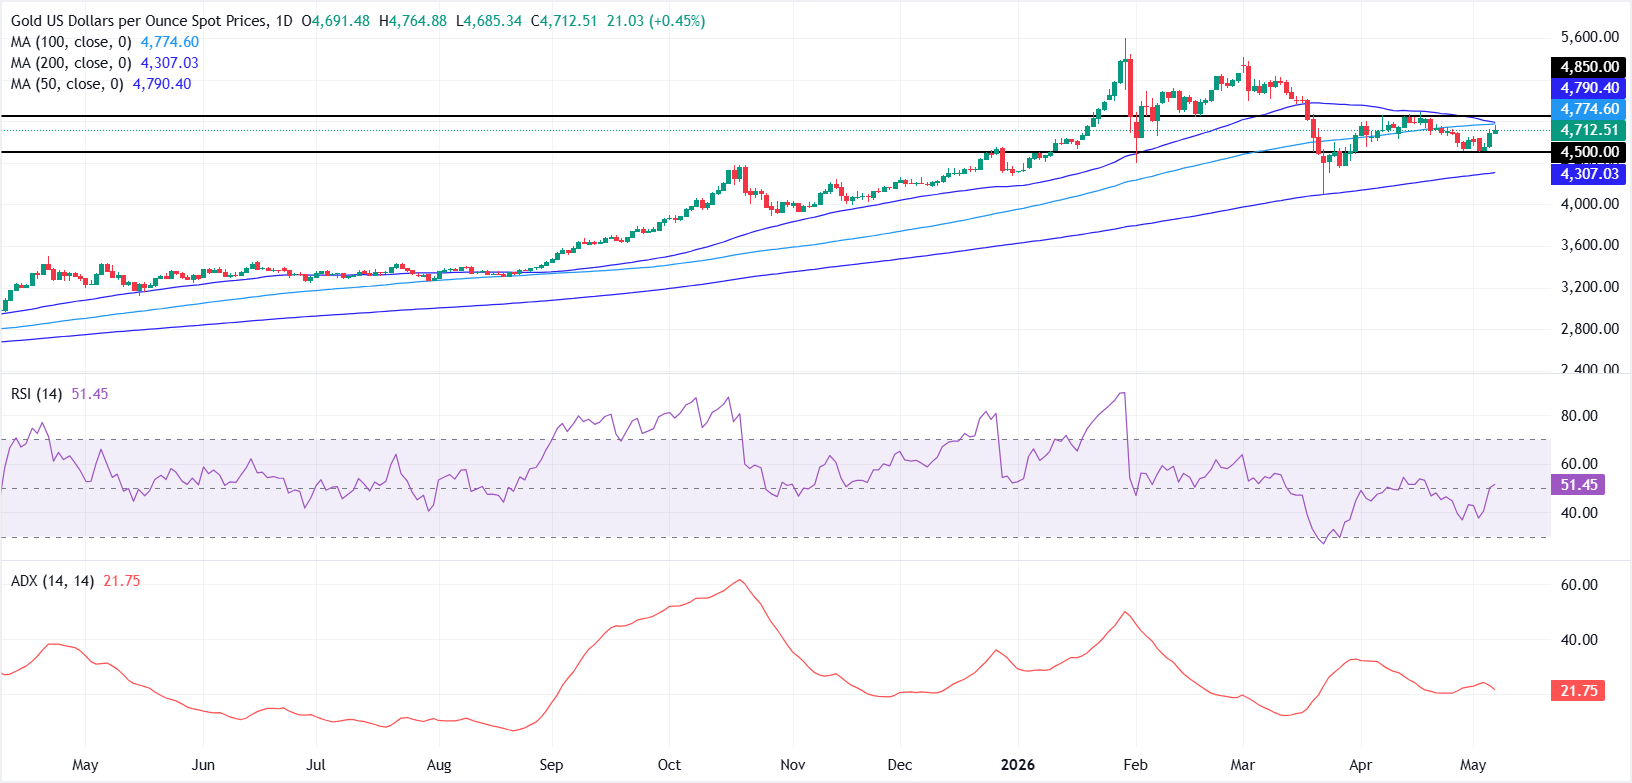
On the daily chart, XAU/USD sits in a neutral, range-bound stance, holding above the 200-day Simple Moving Average (SMA) near $4,307 but capped beneath the 100-day SMA at about $4,774 and the 50-day SMA close to $4,790, which together form a dense supply zone overhead. The Relative Strength Index (RSI) around 53 hints at mildly positive but non-impulsive momentum, while the subdued Average Directional Index (ADX) near 21 suggests the prevailing consolidation lacks a strong directional trend.
On the topside, initial resistance is located at the 100-day SMA near $4,774, followed by the 50-day SMA around $4,790, ahead of a more prominent horizontal barrier at $4,850. On the downside, the first notable support emerges near the horizontal floor at $4,500, with the 200-day SMA around $4,307 providing a deeper structural backing in the event of a broader pullback.
(The technical analysis of this story was written with the help of an AI tool.)
Gold FAQs
Gold has played a key role in human’s history as it has been widely used as a store of value and medium of exchange. Currently, apart from its shine and usage for jewelry, the precious metal is widely seen as a safe-haven asset, meaning that it is considered a good investment during turbulent times. Gold is also widely seen as a hedge against inflation and against depreciating currencies as it doesn’t rely on any specific issuer or government.
Central banks are the biggest Gold holders. In their aim to support their currencies in turbulent times, central banks tend to diversify their reserves and buy Gold to improve the perceived strength of the economy and the currency. High Gold reserves can be a source of trust for a country’s solvency. Central banks added 1,136 tonnes of Gold worth around $70 billion to their reserves in 2022, according to data from the World Gold Council. This is the highest yearly purchase since records began. Central banks from emerging economies such as China, India and Turkey are quickly increasing their Gold reserves.
Gold has an inverse correlation with the US Dollar and US Treasuries, which are both major reserve and safe-haven assets. When the Dollar depreciates, Gold tends to rise, enabling investors and central banks to diversify their assets in turbulent times. Gold is also inversely correlated with risk assets. A rally in the stock market tends to weaken Gold price, while sell-offs in riskier markets tend to favor the precious metal.
The price can move due to a wide range of factors. Geopolitical instability or fears of a deep recession can quickly make Gold price escalate due to its safe-haven status. As a yield-less asset, Gold tends to rise with lower interest rates, while higher cost of money usually weighs down on the yellow metal. Still, most moves depend on how the US Dollar (USD) behaves as the asset is priced in dollars (XAU/USD). A strong Dollar tends to keep the price of Gold controlled, whereas a weaker Dollar is likely to push Gold prices up.
Author

Vishal Chaturvedi
FXStreet
I am a macro-focused research analyst with over four years of experience covering forex and commodities market. I enjoy breaking down complex economic trends and turning them into clear, actionable insights that help traders stay ahead of the curve.














