Gold holds near $5,000 as Fed decision and global central bank policies loom
- Gold trades flat near $5,000 as the US Dollar and Treasury yields ease.
- Markets await the Fed interest rate decision and guidance from other major central banks this week.
- Technically, XAU/USD faces selling pressure as prices test the key $5,000 support.

Gold (XAU/USD) trades broadly flat on Monday, even as the US Dollar (USD) and Treasury yields ease after their recent rally. Oil-driven inflation concerns stemming from the ongoing US-Iran war raise the risk that central banks will keep borrowing costs elevated for longer, which continues to cap the metal’s upside despite heightened geopolitical tensions.
At the time of writing, XAU/USD trades around $4,990 after hitting an intraday high of $5,038 earlier in the European trading session.
Strait of Hormuz in focus as Oil prices surge
Shipping disruptions in the Strait of Hormuz remain a key concern as the US-Iran war enters its third week. Oil prices have risen sharply since the US-Israel joint strikes on Iran, with Brent crude currently up about 33% and West Texas Intermediate (WTI) around 37% from pre-conflict levels.
Over the weekend, Middle East war headlines pointed to a further escalation, increasing concerns that the conflict could become prolonged and continue to affect global energy markets.
The United States conducted airstrikes on Iran’s Kharg Island, targeting military sites. US President Donald Trump warned that the US could strike Iran’s oil infrastructure if Tehran interferes with ships passing through the Strait of Hormuz. He also called on countries including China, the United Kingdom, France, Japan and South Korea to send warships to help keep the waterway open for shipping.
Iran’s Foreign Minister Abbas Araghchi said that the Strait of Hormuz would be closed only to “enemies and those supporting their aggression,” according to Iran’s SNN news agency.
With no clear signs of de-escalation in the conflict, Oil prices are expected to remain elevated in the near term. International Energy Agency IEA Executive Director Fatih Birol said it will take time for global energy trade to recover and added that “we must be prepared if the conflict continues for a while longer.”
Higher energy costs could feed into consumer inflation, raising the risk of stagflation and forcing major central banks to reassess their monetary policy outlook.
Investors have started to scale back expectations for Federal Reserve (Fed) interest rate cuts, with the probability of a 25-basis-point (bps) cut in June falling to 23.6% from 51.2% a month ago, according to the CME FedWatch Tool. Markets are now pricing in only one interest-rate cut by the end of the year, compared with earlier expectations for two cuts.
Global central bank decisions in the spotlight this week
Traders now await the Fed’s interest-rate decision on Wednesday, where the central bank is widely expected to keep rates unchanged at 3.50%-3.75%. The focus will be on Fed Chair Jerome Powell’s forward guidance, as investors look for clues on how policymakers assess the impact of surging Oil prices on the economic outlook.
Markets will also watch the updated Summary of Economic Projections (SEP) and the dot plot for signals on the future path of interest rates.
Alongside the Fed, several other major central banks are also set to announce policy decisions this week, including the Bank of England (BoE), the European Central Bank (ECB), the Bank of Japan (BoJ), the Bank of Canada (BoC) and the Reserve Bank of Australia (RBA), with the BoE, ECB, BoJ and BoC expected to keep policy unchanged while the RBA is seen as likely to raise interest rates again.
Technical analysis: XAU/USD tests $5,000 as bearish pressure builds
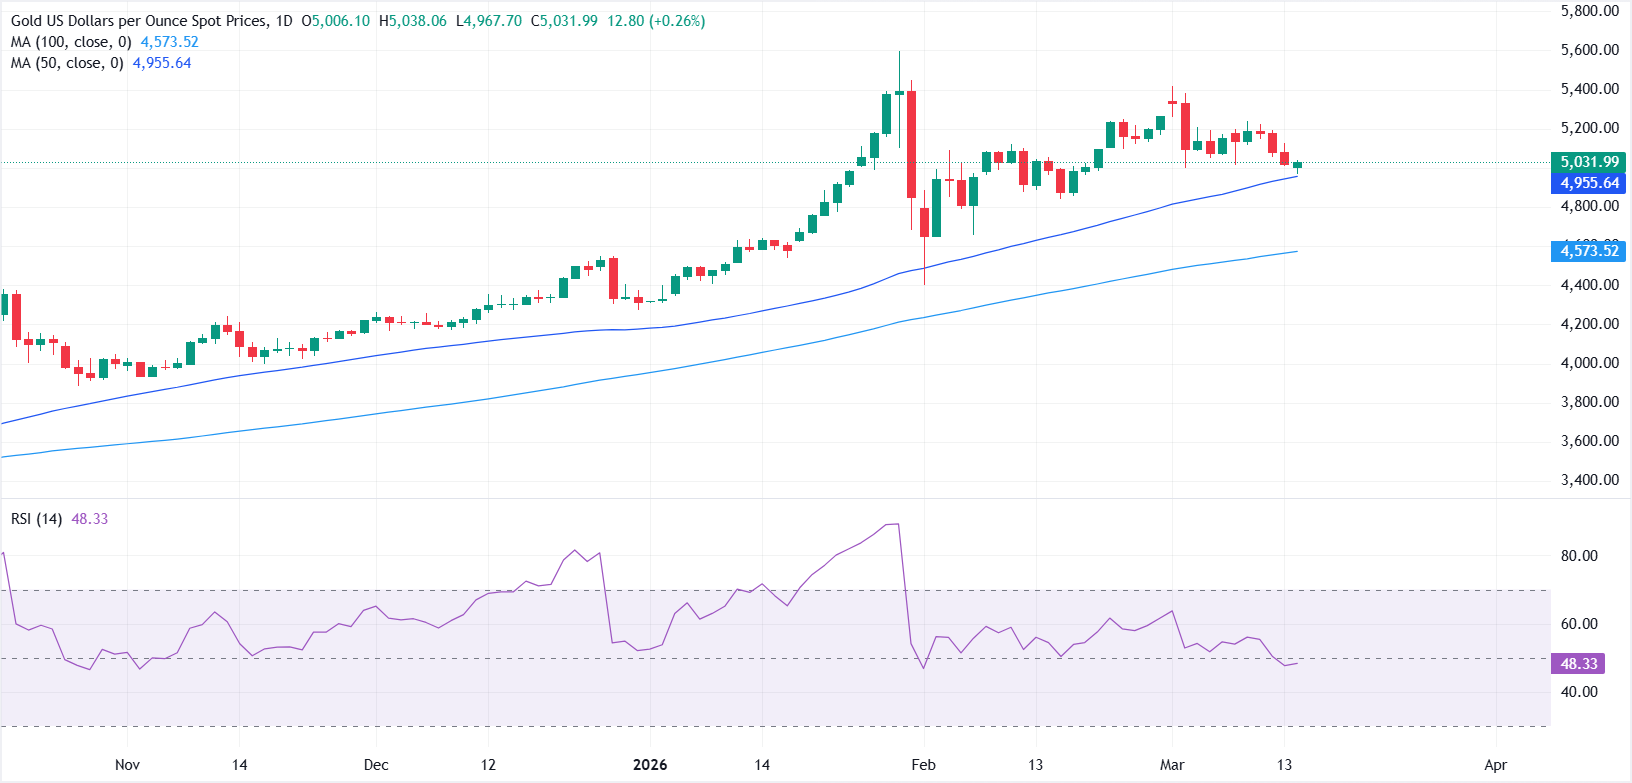
From a technical perspective, XAU/USD continues to face selling pressure, with prices now testing the key $5,000 psychological level. On the daily chart, the near-term bias has turned mildly bearish as spot drifts back toward the rising 50-day Simple Moving Average (SMA) near $4,955. However, prices remain comfortably above the ascending 100-day SMA, which continues to preserve the broader uptrend.
The Relative Strength Index (RSI) has retreated toward 47, below the 50 midline, signaling fading bullish momentum. The Moving Average Convergence Divergence (MACD) line trades below its Signal line and below the zero mark with a deepening negative histogram, reinforcing building downside pressure in the near term.
A decisive break below the $5,000 psychological level and the 50-day SMA near $4,955 could accelerate selling pressure and expose the 100-day SMA around $4,573. On the upside, the $5,200 region remains a key resistance level that bulls need to clear to regain upward momentum.
US Dollar Price Today
The table below shows the percentage change of US Dollar (USD) against listed major currencies today. US Dollar was the strongest against the Canadian Dollar.
| USD | EUR | GBP | JPY | CAD | AUD | NZD | CHF | |
|---|---|---|---|---|---|---|---|---|
| USD | -0.55% | -0.44% | -0.40% | -0.26% | -1.02% | -1.27% | -0.48% | |
| EUR | 0.55% | 0.20% | 0.16% | 0.31% | -0.47% | -0.59% | 0.07% | |
| GBP | 0.44% | -0.20% | 0.04% | 0.11% | -0.66% | -0.82% | -0.08% | |
| JPY | 0.40% | -0.16% | -0.04% | 0.16% | -0.62% | -0.71% | -0.09% | |
| CAD | 0.26% | -0.31% | -0.11% | -0.16% | -0.76% | -0.93% | -0.19% | |
| AUD | 1.02% | 0.47% | 0.66% | 0.62% | 0.76% | -0.15% | 0.65% | |
| NZD | 1.27% | 0.59% | 0.82% | 0.71% | 0.93% | 0.15% | 0.73% | |
| CHF | 0.48% | -0.07% | 0.08% | 0.09% | 0.19% | -0.65% | -0.73% |
The heat map shows percentage changes of major currencies against each other. The base currency is picked from the left column, while the quote currency is picked from the top row. For example, if you pick the US Dollar from the left column and move along the horizontal line to the Japanese Yen, the percentage change displayed in the box will represent USD (base)/JPY (quote).
Author

Vishal Chaturvedi
FXStreet
I am a macro-focused research analyst with over four years of experience covering forex and commodities market. I enjoy breaking down complex economic trends and turning them into clear, actionable insights that help traders stay ahead of the curve.