GBP/USD Price Forecast: Stalls around 1.2780, risks skewed to the downside
- GBP/USD remains range-bound between 1.2686 and 1.2785, with resistance at 50-DMA capping further gains.
- Sellers maintain control; RSI below the 50-neutral line suggests continued sideways movement.
- Below 1.2700, support targets are 1.2686, 1.2659, and 1.2600; above 1.2786, resistance levels include 1.2800 and 1.2861.

The Pound Sterling consolidates around the 1.2758 area on Monday, extending its gains for three straight days. However, it faces strong resistance at the 50-day moving average (DMA) at 1.2784, which quickly rejected the GBP/USD, which trades virtually unchanged, up 0.02%.
GBP/USD Price Forecast: Technical outlook
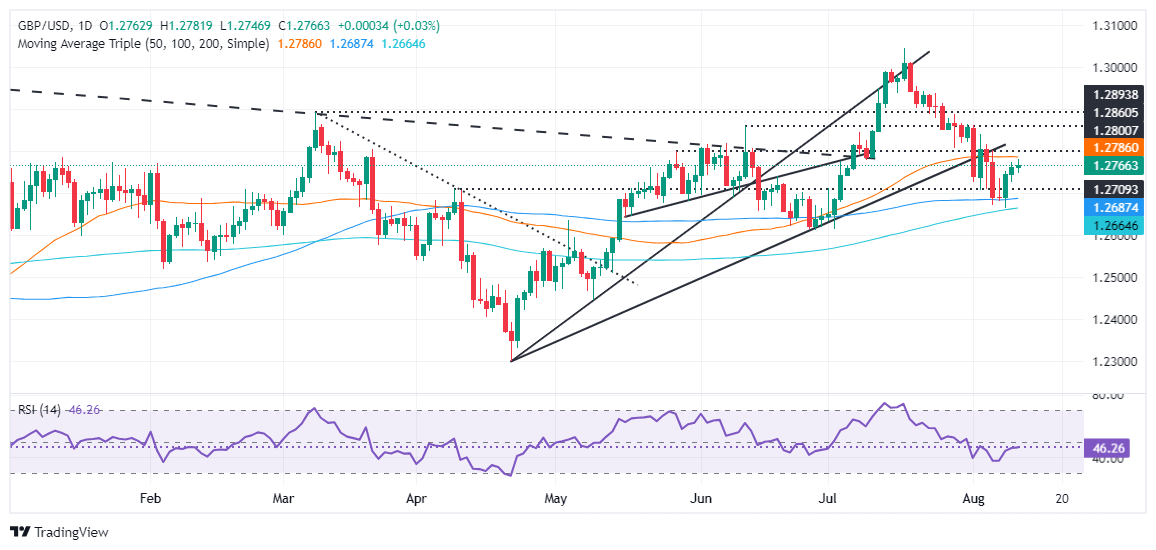
The GBP/USD is neutral biased, capped by the 50 and 100-DMA, the latter at 1.2686, with traders unable to crack the top-bottom of the 1.2686-1.2785 range, for the fourth straight day.
Momentum shows that sellers are in charge, as depicted by the Relative Strength Index (RSI) being below the 50-neutral line, but its flatlines hint that the GBP/USD could remain sideways.
If GBP/USD clears the 1.2700 figure, the next support would be the 100-DMA at 1.2686, ahead of the 200-DMA at 1.2659. Once those two levels are taken, the next stop would be the 1.2600 figure, followed by the latest cycle low of 1.2445, the May 9 daily low.
On the other hand, if GBP/USD rallies past 1.2786, look for a challenge of the 1.2800 figure. A breach of the latter will expose the June 12 peak at 1.2861 before buyers could test the 1.2900 psychological figure.
GBP/USD Price Action – Daily Chart
Pound Sterling FAQs
The Pound Sterling (GBP) is the oldest currency in the world (886 AD) and the official currency of the United Kingdom. It is the fourth most traded unit for foreign exchange (FX) in the world, accounting for 12% of all transactions, averaging $630 billion a day, according to 2022 data. Its key trading pairs are GBP/USD, aka ‘Cable’, which accounts for 11% of FX, GBP/JPY, or the ‘Dragon’ as it is known by traders (3%), and EUR/GBP (2%). The Pound Sterling is issued by the Bank of England (BoE).
The single most important factor influencing the value of the Pound Sterling is monetary policy decided by the Bank of England. The BoE bases its decisions on whether it has achieved its primary goal of “price stability” – a steady inflation rate of around 2%. Its primary tool for achieving this is the adjustment of interest rates. When inflation is too high, the BoE will try to rein it in by raising interest rates, making it more expensive for people and businesses to access credit. This is generally positive for GBP, as higher interest rates make the UK a more attractive place for global investors to park their money. When inflation falls too low it is a sign economic growth is slowing. In this scenario, the BoE will consider lowering interest rates to cheapen credit so businesses will borrow more to invest in growth-generating projects.
Data releases gauge the health of the economy and can impact the value of the Pound Sterling. Indicators such as GDP, Manufacturing and Services PMIs, and employment can all influence the direction of the GBP. A strong economy is good for Sterling. Not only does it attract more foreign investment but it may encourage the BoE to put up interest rates, which will directly strengthen GBP. Otherwise, if economic data is weak, the Pound Sterling is likely to fall.
Another significant data release for the Pound Sterling is the Trade Balance. This indicator measures the difference between what a country earns from its exports and what it spends on imports over a given period. If a country produces highly sought-after exports, its currency will benefit purely from the extra demand created from foreign buyers seeking to purchase these goods. Therefore, a positive net Trade Balance strengthens a currency and vice versa for a negative balance.
British Pound PRICE Today
The table below shows the percentage change of British Pound (GBP) against listed major currencies today. British Pound was the strongest against the Japanese Yen.
| USD | EUR | GBP | JPY | CAD | AUD | NZD | CHF | |
|---|---|---|---|---|---|---|---|---|
| USD | -0.02% | -0.02% | 0.74% | 0.02% | -0.34% | -0.35% | 0.53% | |
| EUR | 0.02% | 0.02% | 0.81% | 0.04% | -0.44% | -0.33% | 0.56% | |
| GBP | 0.02% | -0.02% | 1.04% | 0.02% | -0.47% | -0.35% | 0.55% | |
| JPY | -0.74% | -0.81% | -1.04% | -0.75% | -1.19% | -1.13% | -0.28% | |
| CAD | -0.02% | -0.04% | -0.02% | 0.75% | -0.42% | -0.37% | 0.54% | |
| AUD | 0.34% | 0.44% | 0.47% | 1.19% | 0.42% | 0.12% | 1.02% | |
| NZD | 0.35% | 0.33% | 0.35% | 1.13% | 0.37% | -0.12% | 0.90% | |
| CHF | -0.53% | -0.56% | -0.55% | 0.28% | -0.54% | -1.02% | -0.90% |
The heat map shows percentage changes of major currencies against each other. The base currency is picked from the left column, while the quote currency is picked from the top row. For example, if you pick the British Pound from the left column and move along the horizontal line to the US Dollar, the percentage change displayed in the box will represent GBP (base)/USD (quote).
Author

Christian Borjon Valencia
FXStreet
Markets analyst, news editor, and trading instructor with over 14 years of experience across FX, commodities, US equity indices, and global macro markets.


