GBP/USD Price Forecast: Hovers below nine-day EMA near 1.2500
- GBP/USD could test the upper boundary around the 1.2560 level to re-enter into the descending channel.
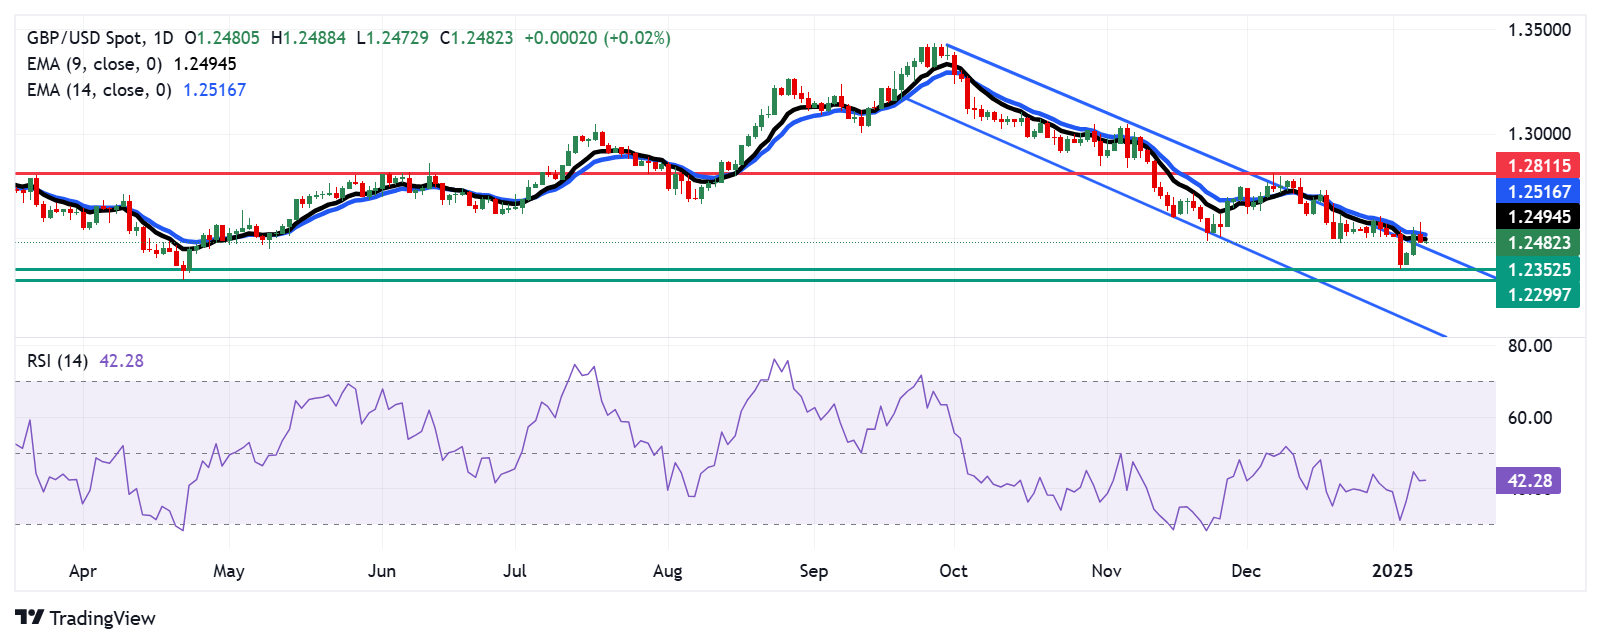
- The 14-day RSI stays below the 50 level, indicating sustained bearish pressure.
- The initial resistance appears at its nine-day EMA at 1.2494 level.

The GBP/USD pair maintains its position after registering losses in the previous session, hovering around 1.2480 during Wednesday's Asian hours. Technical analysis on the daily chart points to a weakening bearish trend, as the pair is trading above the upper boundary of a descending channel pattern.
Despite this, the 14-day Relative Strength Index (RSI) remains below the 50 level, signaling continued bearish pressure. Furthermore, the pair is positioned below both the nine- and 14-day Exponential Moving Averages (EMAs), indicating weak short-term price momentum. A clear breakout above these EMAs could signal a shift from a bearish to a bullish outlook.
On the downside, GBP/USD could test the upper boundary near the 1.2560 level, potentially re-entering the descending channel. A reversal into the channel would reinforce the bearish bias, possibly driving the pair toward the nine-month low of 1.2352, recorded on January 2. The next support level is at 1.2299, the lowest since November 2023, last seen on April 22.
The GBP/USD pair faces immediate resistance at its nine-day Exponential Moving Average (EMA) at 1.2494, followed by the 14-day EMA at 1.2516. A successful breakout above these levels could boost short-term price momentum, opening the door for a move toward the two-month high of 1.2811, reached on December 6.
GBP/USD: Daily Chart
British Pound PRICE Today
The table below shows the percentage change of British Pound (GBP) against listed major currencies today. British Pound was the strongest against the Japanese Yen.
| USD | EUR | GBP | JPY | CAD | AUD | NZD | CHF | |
|---|---|---|---|---|---|---|---|---|
| USD | -0.04% | -0.01% | 0.24% | -0.07% | 0.05% | 0.05% | -0.00% | |
| EUR | 0.04% | 0.04% | 0.29% | -0.02% | 0.09% | 0.10% | 0.04% | |
| GBP | 0.00% | -0.04% | 0.26% | -0.06% | 0.04% | 0.06% | 0.00% | |
| JPY | -0.24% | -0.29% | -0.26% | -0.31% | -0.19% | -0.19% | -0.24% | |
| CAD | 0.07% | 0.02% | 0.06% | 0.31% | 0.11% | 0.12% | 0.06% | |
| AUD | -0.05% | -0.09% | -0.04% | 0.19% | -0.11% | 0.00% | -0.05% | |
| NZD | -0.05% | -0.10% | -0.06% | 0.19% | -0.12% | -0.01% | -0.06% | |
| CHF | 0.00% | -0.04% | -0.01% | 0.24% | -0.06% | 0.05% | 0.06% |
The heat map shows percentage changes of major currencies against each other. The base currency is picked from the left column, while the quote currency is picked from the top row. For example, if you pick the British Pound from the left column and move along the horizontal line to the US Dollar, the percentage change displayed in the box will represent GBP (base)/USD (quote).
Author

Akhtar Faruqui
FXStreet
Akhtar Faruqui is a Forex Analyst based in New Delhi, India. With a keen eye for market trends and a passion for dissecting complex financial dynamics, he is dedicated to delivering accurate and insightful Forex news and analysis.


