|

GBP/USD Price Analysis: Rebound at two-week lows, as double-bottom suggests potential gains

  • GBP/USD edges north amid slight optimism in the Asian session.
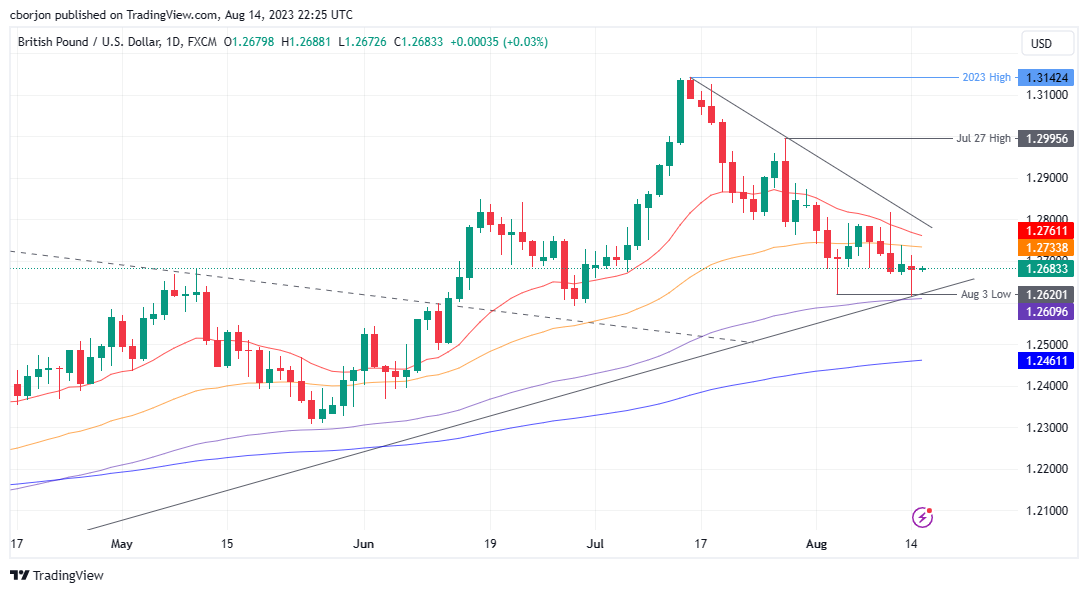
  • A double bottom chart pattern could pave the way for the GBP/USD towards 1.3000.
  • Immediate resistance is seen at the 50-day and 20-day EMAs. Breaking these could propel the pair toward the August 10 and July 27 highs. However, a breach below the 100-day EMA could shift momentum toward the 200-day EMA.

GBP/USD aims upward for minimal gains of 0.02% as the Asian session begins, but still printing weekly losses following Monday’s session in which the GBP/USD lost 0.10% and reached a two-week low. At the time of writing, the GBP/USD exchanges hands at 1.2682.

GBP/USD Price Analysis: Technical outlook

From a technical perspective, the GBP/USD is neutral-upward biased, as the major dived towards the 100-day Exponential Moving Average (EMA) at 1.2609. Still, buyers entered the market, lifting the spot price to current levels. Notably, the GBP/USD is forming a ‘double bottom’ chart pattern that could pave the way for further gains, but first, the GBP/USD must reclaim resistance technical levels to confirm its validity.

The GBP/USD first resistance would be the 50-day EMA at 1.2733, followed by the 20-day EMA at 1.2761. Once those levels are surpassed, the GBP/USD next stop would be the August 10 high of 1.2819. If buyers push prices above those levels, the July 27 daily high at 1.2995 would be up for grabs.

On the other hand, if GBP/USD tumbled past the 100-day EMA at 1.2609, it would clear the way to challenge 1.2600 and the 200-day EMA at 1.2461.

GBP/USD Price Action – Daily chart
GBP/USD

Overview
Today last price1.2683
Today Daily Change-0.0013
Today Daily Change %-0.10
Today daily open1.2696
 
Trends
Daily SMA201.2825
Daily SMA501.2764
Daily SMA1001.2609
Daily SMA2001.2351
 
Levels
Previous Daily High1.2739
Previous Daily Low1.2666
Previous Weekly High1.2819
Previous Weekly Low1.2666
Previous Monthly High1.3142
Previous Monthly Low1.2659
Daily Fibonacci 38.2%1.2711
Daily Fibonacci 61.8%1.2694
Daily Pivot Point S11.2662
Daily Pivot Point S21.2628
Daily Pivot Point S31.2589
Daily Pivot Point R11.2735
Daily Pivot Point R21.2773
Daily Pivot Point R31.2807
 

Author

Christian Borjon Valencia

Markets analyst, news editor, and trading instructor with over 14 years of experience across FX, commodities, US equity indices, and global macro markets.


More from Christian Borjon Valencia
Share:

Editor's Picks

AUD/USD climbs as Fed’s Williams push the brakes on rates

The Aussie Dollar registers a gain of over 0.34% against the US Dollar on Tuesday as news flows remain quiet, with US data coming mixed, while hostilities in the Middle East continue. The AUD/USD trades at 0.6983.

USD/JPY extends retreat below 158.50 as intervention risks loom

USD/JPY is dropping below 158.50 in the Asian session on Tuesday, snapping a two-day winning streak and pulling back from an over two-week top touched the previous day, despite Japan's soft PPI inflation print. Bulls turn cautious amid speculation that authorities will step in to prop up the Japanese Yen, which, in turn, weighs on the pair.

Gold: Bears struggle to breach below $4,150

Gold now gives away its initial gains and resumes its decline, revisiting the $4,160 region per troy ounce on Tuesday. The precious metal’s pullback comes despite the fresh downward trend in the Greenback in combination with a mixed performance of US Treasury yields across the board and easing tensions on the geopolitical front.

Ethereum holds $2,500 as open interest drops to lowest level since February
Ethereum (ETH) quickly bounced back above $2,500 on Tuesday after sharp Asian equity selloffs briefly spilled into the crypto market. South Korea's KOSPI declined 5.4% while Japan's Nikkei 225 dropped by 1.8%. The volatility spike bled into cryptocurrencies, triggering a cascade of forced liquidations.
S&P 500 earnings just hit a record. The AI data centre bill hasn't landed yet
S&P 500 companies are on track for a third straight quarter of earnings growth above 25%, according to FactSet. Their profit margin hit 17% in the April-June quarter, the highest in FactSet data going back to 2009. The cash behind those earnings has been shrinking for two years, and almost all of the shrinkage is in the handful of companies building data centres for artificial intelligence (AI).
Has Bitcoin really escaped the macro forces it was built to fight?
Over 17 years ago, Satoshi Nakamoto designed Bitcoin (BTC) on the back of a global financial crisis as an alternative to the global monetary system outside the control of central banks, governments and traditional intermediaries. This raises a key question: has Bitcoin really become independent of the macroeconomic forces it was built to challenge?