|

GBP/USD Price Analysis: Clings near 1.2720 followed by the barrier at 14-day EMA

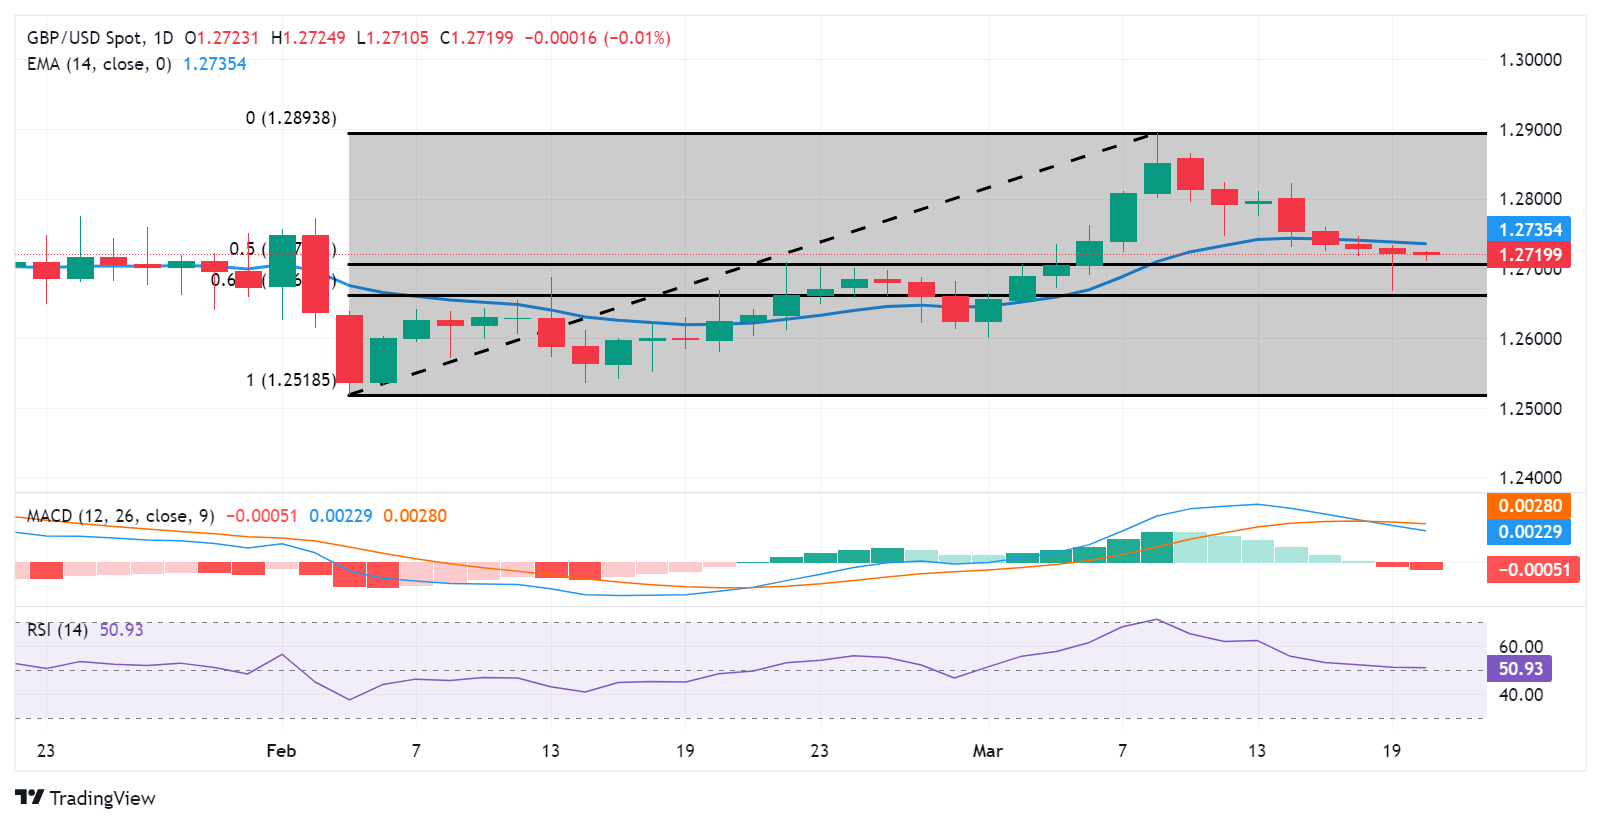
  • GBP/USD pair could target immediate support around the 50.0% retracement level of 1.2706.
  • MACD, the lagging indicator, suggests a tepid momentum for the pair.
  • The key barrier could be found at the 14-day EMA of 1.2735 level and major resistance of 1.2750 level.

GBP/USD trims intraday losses and attempts to snap its losing streak on Wednesday. The GBP/USD pair hovers near 1.2720 during the Asian trading hours. The market adopts cautious sentiment ahead of the Federal Reserve’s (Fed) interest rate decision later in the North American session.

The GBP/USD pair finds immediate support at the 50.0% retracement level of 1.2706, in conjunction with the psychological level of 1.2700. A break below this level could put downward pressure on the pair to navigate the region around the 61.8% Fibonacci retracement level of 1.2661, followed by the major support of 1.2650 level.

The technical analysis of the GBP/USD pair shows that the 14-day Relative Strength Index (RSI) is positioned above 50. This indicates a bullish momentum for the pair. However, the Moving Average Convergence Divergence (MACD), a lagging indicator, suggests a tepid momentum for the pair. the MACD line is situated above the centerline but shows divergence below the signal line.

On the upside, the GBP/USD pair could meet the key barrier at the 14-day Exponential Moving Average (EMA) of 1.2735 level followed by the major resistance of 1.2750 level. A break above the latter could exert upward support for the pair to explore the area around the psychological level at 1.2800.

GBP/USD: Daily Chart
GBP/USD

Overview
Today last price1.2719
Today Daily Change-0.0002
Today Daily Change %-0.02
Today daily open1.2721
 
Trends
Daily SMA201.272
Daily SMA501.2686
Daily SMA1001.2626
Daily SMA2001.2594
 
Levels
Previous Daily High1.2733
Previous Daily Low1.2668
Previous Weekly High1.2865
Previous Weekly Low1.2725
Previous Monthly High1.2773
Previous Monthly Low1.2518
Daily Fibonacci 38.2%1.2693
Daily Fibonacci 61.8%1.2708
Daily Pivot Point S11.2682
Daily Pivot Point S21.2642
Daily Pivot Point S31.2616
Daily Pivot Point R11.2747
Daily Pivot Point R21.2773
Daily Pivot Point R31.2813

Author

Akhtar Faruqui

Akhtar Faruqui is a Forex Analyst based in New Delhi, India. With a keen eye for market trends and a passion for dissecting complex financial dynamics, he is dedicated to delivering accurate and insightful Forex news and analysis.


More from Akhtar Faruqui
Share:

Editor's Picks

AUD/USD breaks below 0.7000 ahead of inflation data

AUD/USD has accelerated its downward trend on Tuesday, breaching below the key 0.7000 yardstick ahead of the opening bell in Asia on Wednesday. Indeed, spot has retreated for the second day in a row despite the hawkish hike by the RBA early on Tuesday and in response to the continuation of the move higher in the Greenback. Looking ahead, all the attention will be on the release of Australia’s inflation data on Wednesday.

USD/JPY consolidates near 157.50 as a bullish USD counters intervention risks

USD/JPY struggles to capitalize on the overnight bounce from a one-week low, consolidating around 157.50 in the Asian session on Tuesday. Trump's concerns about the Japanese Yen's weakness fueled speculation about another US-Japan joint intervention. This, along with the hawkish BoJ, underpins the JPY and caps the currency pair. Meanwhile, rising Fed rate-hike bets and oil-driven inflation fears continue to push US bond yields to multi-year highs, keeping the US Dollar pinned near a two-month high and supporting the pair.

Gold trims gains; back toward $4,150

Gold now surrenders some of its initial advance and retests the $4,150 zone per troy ounce on Tuesday. Meanwhile, the move higher in the yellow metal comes despite the firmer US Dollar and rising US Treasury yields across the board, while escalating geopolitical tensions appear to limit the downside potential.

XRP advances within a robust technical structure
Ripple (XRP) shows signs of stabilizing after reclaiming support at $1.50 on Tuesday. A robust technical structure underpins the token’s short to medium-term bullish outlook. Still, XRP is not out of the woods yet, as profit-taking and buyer exhaustion could weigh on price action and extend the recent correction from September highs around $1.66.
RBA recap: Rate hikes are on the table as demand stays too strong

The Reserve Bank of Australia unanimously tightened monetary policy, warning that inflation remained too high and that several upside risks had begun to materialise. Governor Michele Bullock said the Board would raise rates again if necessary.

Silver is more volatile than Gold ahead of PCE and NFP. This chart shows the positioning gap
The market’s attention is focused on American data this week, but there’s something only those with a trained eye may be looking at: Gold and Silver positioning gap. Financial markets are moving on fears, mostly related to persistently high energy prices driven by the Middle East war. Sure, the US Dollar (USD) is strong, but at what cost?