GBP/JPY threatens the 20-day SMA after disappointing British PMIs
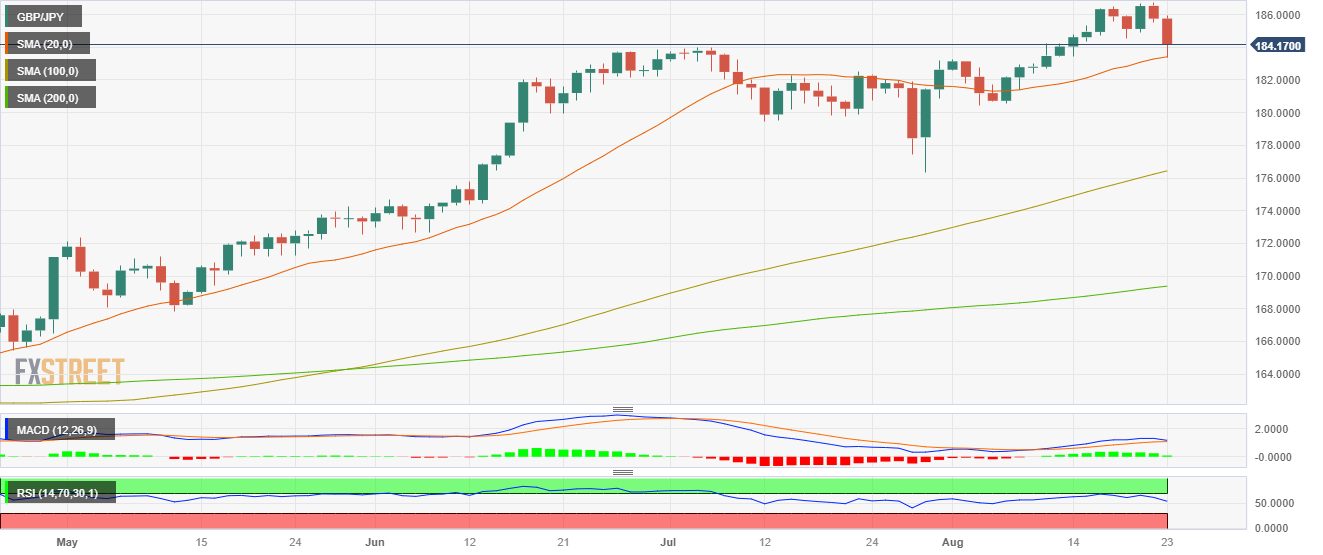
- GBP/JPY tested the 20-day SMA at 183.30 and then settled above 184.00.
- In line with the global trend, the Services PMI from the UK fell to contraction territory in August.
- Japanese PMIs showed optimistic results.
- Monetary Policy divergences between the BoJ and BoE may limit the downside.

The JPY is trading strong against most of its rivals, including the USD, GBP, EUR and AUD, as its PMIs showed better-than-expected results in August. On the other hand, the UK reported soft PMIs from August, which made the Pound lose interest in the FX markets.
British PMIs from August showed poor results. The Manufacturing declined deep into negative territory and fell to 42.5, while the Services PMI dropped below the 50 threshold to 48.7, both coming lower than expected. It's worth noticing that the Bank of England (BoE), in its last meeting, stated that it no longer expects a recession, so weak data seem to be surprising the markets.
The British yields show sharp declines as a reaction, with the Bank of England’s tightening expectations falling slightly. That being said, investors continue to price in higher odds of a terminal rate of 6% for this cycle.
On the Japanese side, the Jibun Bank PMIs came in higher than expected, but the Manufacturing PMIs remained in contraction territory while the Service index stood above 50 in August. Furthermore, the JPY has gained traction on the back of the rise of the Japanese government yields, which stood at highs since 2014, and markets are pledging the Bank of Japan (BoJ) to pivot. That being said, no signs have been given by the Japanese banking authority, which seems to be comfortable maintaining its negative interest rate policy, so divergences from the BoJ and its peers may limit the upside for the Yen.
GBP/JPY Levels to watch
The daily chart shows signs of bullish exhaustion for GBP/JPY, contributing to a neutral, bearish technical stance. Both the Relative Strength Index (RSI) and Moving Average Convergence Divergence (MACD) exhibit indications of fading momentum. The RSI has a negative slope above its midline, indicating weakening buying pressure, while the Moving Average Convergence (MACD) presents shorter green bars. On the bigger picture, the pair is above the 20,100,200-day Simple Moving Average (SMAs), indicating that the buyers are commanding the broader perspective.
Support levels: 183.30 (20-day SMA), 183.00, 182.50
Resistance levels: 184.00, 184.50, 185.00.
GBP/JPY Daily chart
Author

Patricio Martín
FXStreet
Patricio is an economist from Argentina passionate about global finance and understanding the daily movements of the markets.