GBP/JPY Technical Analysis: a bearish breakdown seems imminent

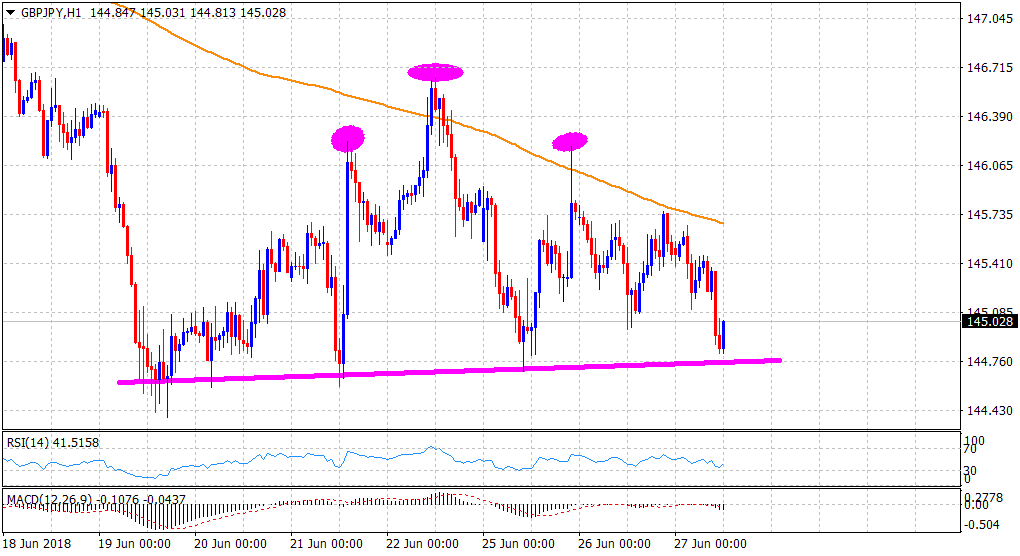
• The cross has failed to sustain above 200-hour SMA and now seems to have formed a bearish Head & Shoulders chart pattern on the 1-hourly chart.
• Short-term technical indicators have struggled to move back in positive territory and further reinforce the bearish chart pattern formation.
• A sustained break below the neckline support would be needed to confirm a fresh breakdown and a resumption of the prior depreciating move.
Current Price: 145.03
Daily High: 145.66
Daily Low: 144.81
Trend: Bearish
Resistance
R1: 145.20 (horizontal level)
R2: 145.68 (200-period SMA H1)
R3: 145.97 (R1 daily pivot-point)
Support
S1: 144.70 (bearish H&S neckline)
S2: 144.39 (June 19 swing low)
S3: 144.00 (round figure mark)
Author

Haresh Menghani
FXStreet
Haresh Menghani is a detail-oriented professional with 10+ years of extensive experience in analysing the global financial markets.


