GBP/JPY Price Forecast: Pound holds above 215.00 as momentum fades
- GBP/JPY holds above 215.00 but struggles to extend recent gains.
- RSI trends lower, signaling weakening bullish momentum at highs.
- Break below 215.00 exposes 214.41 and 214.00 support levels.

GBP/JPY trades sideways on Wednesday, clinging to three consecutive days of gains, as market mood remains neutral, though slightly tilted toward optimism, amid high tensions in the Middle East. Consequently, the British Pound (GBP) —a risk-sensitive currency—appreciated modestly, with the cross-pair remaining above the 215.00 figure for the second straight day.
GBP/JPY Price Forecast: Technical outlook
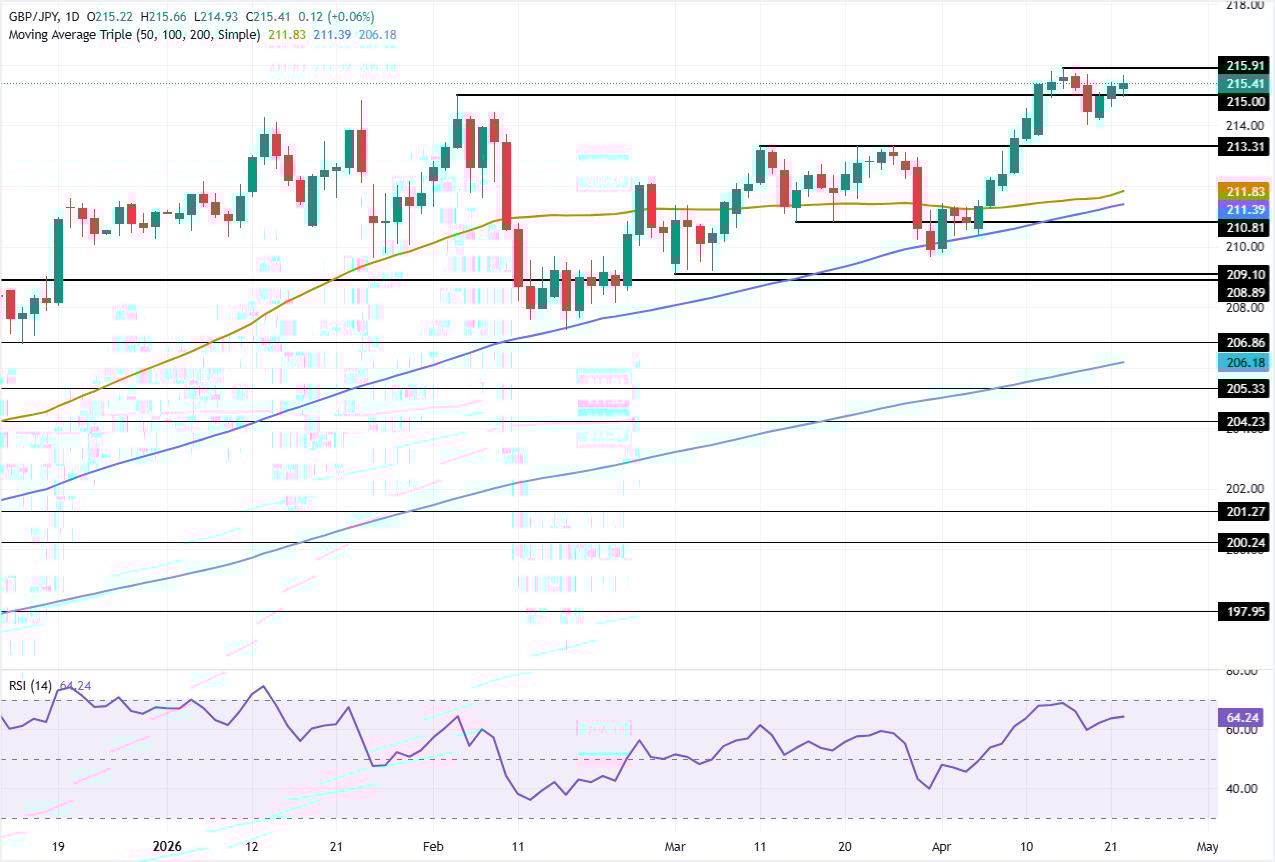
From a technical standpoint, the uptrend seems overextended, with GBP/JPY poised to stall unless a clear catalyst pushes the cross past the yearly peak of 215.91, ahead of the 220.00 figure.
Momentum, as measured by the Relative Strength Index (RSI), is aiming lower, an indication that buyers are losing traction.
If GBP/JPY clears 220.00, the next resistance would be the December 2007 swing high at 230.37. A breach of the latter will expose the October 2007 peak at around 241.39.
On the flip side, if GBP/JPY drops below 215.00, the next demand zone will be the Tuesday daily low at 214.41. On further weakness, the next support would be the April 17 daily low of 214.00, ahead of the 20-day Simple Moving Average (SMA) at 213.25.
GBP/JPY Price Chart – Daily
Pound Sterling Price This week
The table below shows the percentage change of British Pound (GBP) against listed major currencies this week. British Pound was the strongest against the Japanese Yen.
| USD | EUR | GBP | JPY | CAD | AUD | NZD | CHF | |
|---|---|---|---|---|---|---|---|---|
| USD | 0.24% | -0.18% | 0.40% | -0.16% | -0.52% | -0.79% | 0.34% | |
| EUR | -0.24% | -0.41% | 0.13% | -0.38% | -0.72% | -1.07% | 0.10% | |
| GBP | 0.18% | 0.41% | 0.56% | 0.02% | -0.32% | -0.66% | 0.51% | |
| JPY | -0.40% | -0.13% | -0.56% | -0.56% | -0.87% | -1.21% | -0.04% | |
| CAD | 0.16% | 0.38% | -0.02% | 0.56% | -0.26% | -0.65% | 0.50% | |
| AUD | 0.52% | 0.72% | 0.32% | 0.87% | 0.26% | -0.27% | 0.85% | |
| NZD | 0.79% | 1.07% | 0.66% | 1.21% | 0.65% | 0.27% | 1.14% | |
| CHF | -0.34% | -0.10% | -0.51% | 0.04% | -0.50% | -0.85% | -1.14% |
The heat map shows percentage changes of major currencies against each other. The base currency is picked from the left column, while the quote currency is picked from the top row. For example, if you pick the British Pound from the left column and move along the horizontal line to the US Dollar, the percentage change displayed in the box will represent GBP (base)/USD (quote).
(This story was corrected on April 22 at 19:33 GMT to say that the 20-day Simple Moving Average is at 213.25, not 313.25)
Author

Christian Borjon Valencia
FXStreet
Markets analyst, news editor, and trading instructor with over 14 years of experience across FX, commodities, US equity indices, and global macro markets.














