GBP/JPY Price Forecast: Falls toward 195.50 after breaking below nine-day EMA
- GBP/JPY may depreciate further as daily chart analysis suggests a bearish bias.
- The nine-day EMA sits below the 14-day EMA, signaling continued weakness in short-term price momentum.
- The immediate support appears at the lower boundary of the descending channel at 193.50 level.

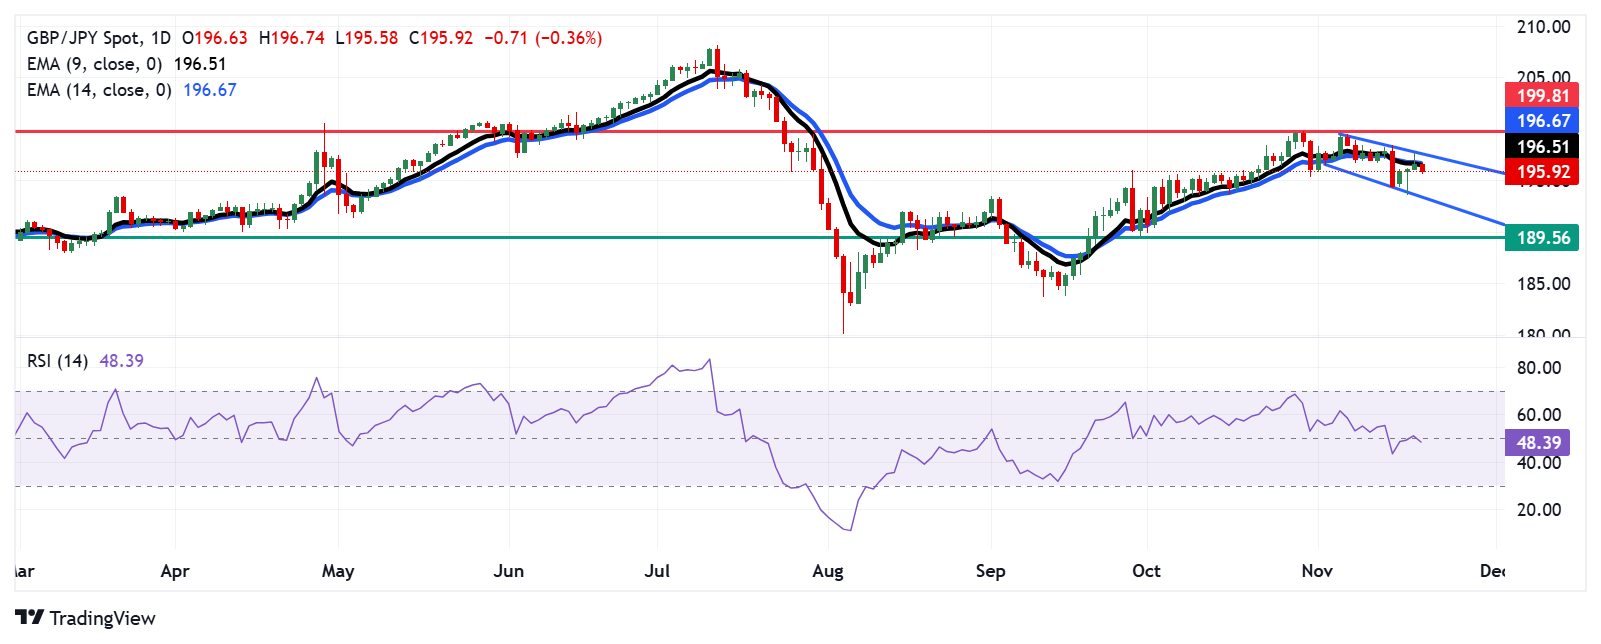
The GBP/JPY cross pares its recent gains, trading around 195.80 during the early European hours on Thursday. The daily chart analysis indicates that the pair is positioned within the descending channel pattern, suggesting a bearish bias.
The 14-day Relative Strength Index (RSI) is slightly below the 50 level, confirming bearish momentum. Additionally, the nine-day Exponential Moving Average (EMA) is positioned below the 14-day EMA, indicating persistent weakness in short-term price momentum.
On the downside, the GBP/JPY cross may navigate the region around the lower boundary of the descending channel at the 193.50 level. A break below this level would reinforce the bearish bias and put downward pressure on the currency cross to revisit the two-month low at the 189.56 level, which was recorded on September 30.
Regarding the upside, the immediate barrier appears at the nine-day EMA at 196.46 level, followed by the 14-day EMA at 196.63 level. Further resistance appears at the upper boundary of the descending channel at 197.70 level. A successful breach above this channel could cause the emergence of the bullish bias and support the GBP/JPY cross to test the four-month high at 199.81 level, reached on October 30.
GBP/JPY: Daily Chart
British Pound PRICE Today
The table below shows the percentage change of British Pound (GBP) against listed major currencies today. British Pound was the weakest against the Japanese Yen.
| USD | EUR | GBP | JPY | CAD | AUD | NZD | CHF | |
|---|---|---|---|---|---|---|---|---|
| USD | -0.07% | -0.06% | -0.48% | -0.09% | -0.21% | 0.06% | -0.21% | |
| EUR | 0.07% | 0.01% | -0.38% | -0.02% | -0.14% | 0.12% | -0.15% | |
| GBP | 0.06% | -0.01% | -0.37% | -0.04% | -0.16% | 0.11% | -0.16% | |
| JPY | 0.48% | 0.38% | 0.37% | 0.37% | 0.26% | 0.49% | 0.25% | |
| CAD | 0.09% | 0.02% | 0.04% | -0.37% | -0.11% | 0.15% | -0.12% | |
| AUD | 0.21% | 0.14% | 0.16% | -0.26% | 0.11% | 0.26% | -0.01% | |
| NZD | -0.06% | -0.12% | -0.11% | -0.49% | -0.15% | -0.26% | -0.27% | |
| CHF | 0.21% | 0.15% | 0.16% | -0.25% | 0.12% | 0.01% | 0.27% |
The heat map shows percentage changes of major currencies against each other. The base currency is picked from the left column, while the quote currency is picked from the top row. For example, if you pick the British Pound from the left column and move along the horizontal line to the US Dollar, the percentage change displayed in the box will represent GBP (base)/USD (quote).
Author

Akhtar Faruqui
FXStreet
Akhtar Faruqui is a Forex Analyst based in New Delhi, India. With a keen eye for market trends and a passion for dissecting complex financial dynamics, he is dedicated to delivering accurate and insightful Forex news and analysis.


