GBP/JPY Price Analysis: Rebounds but faces stiff resistance at 211.00
- GBP/JPY bounces from 100-day SMA as sentiment improves cautiously.
- RSI remains below 50, indicating bearish momentum still in control.
- Break above 212.00 needed to target 213.31 resistance level.

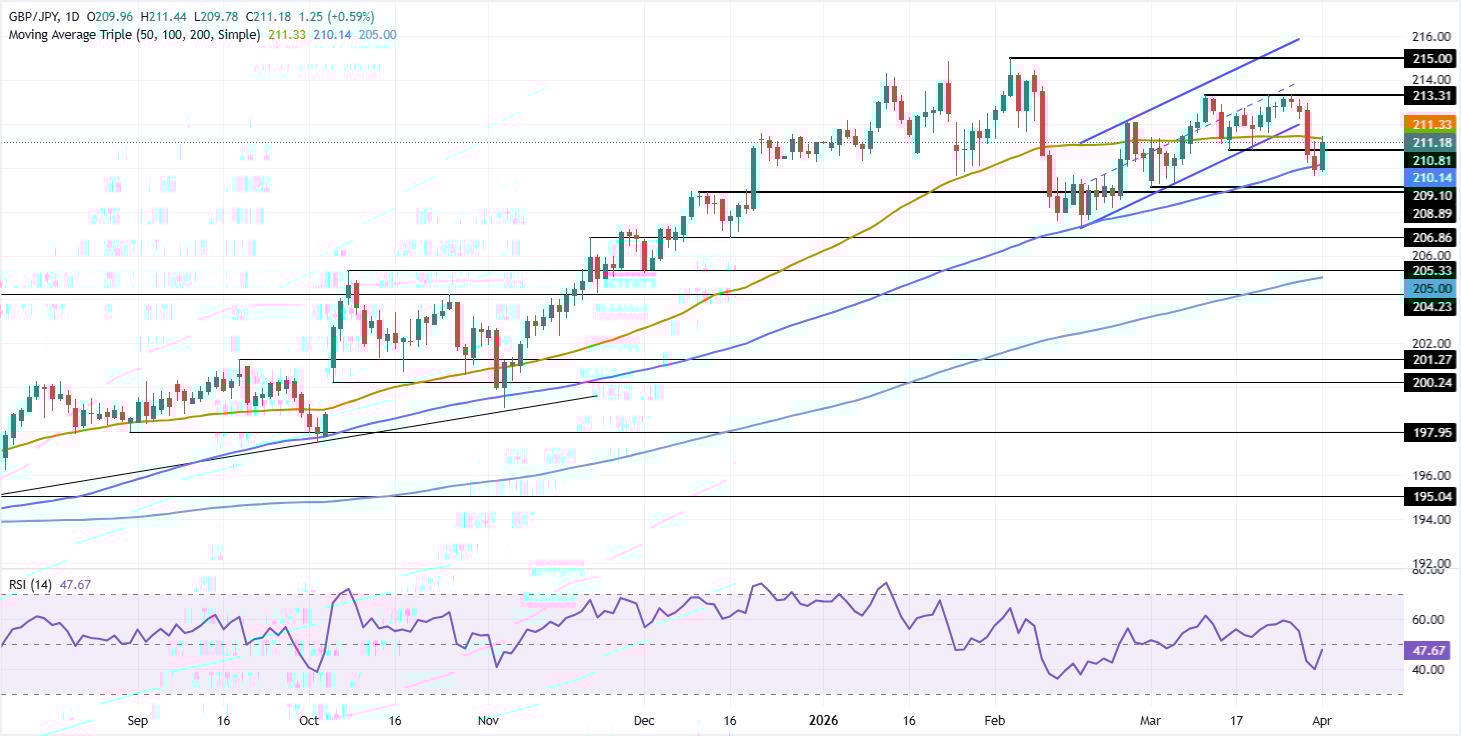
The GBP/JPY edges higher by nearly 0.60% on Wednesday as the market mood improved amid speculation of a possible end to Iran’s war. Although the pair found support at the 100-day Simple Moving Average (SMA) at 210.08, sentiment remains fragile amid geopolitical uncertainty.
GBP/JPY Price Analysis: Technical Outlook
After clearing the bottom of a bearish flag, the GBP/JPY rallied and faces key resistance at the 50-day Simple Moving Average (SMA) at 211.28, as buyers targeted the 20-day SMA at 212.02. Despite the advance, momentum seems tilted to the downside as the Relative Strength Index (RSI) points lower and remains below its neutral level, suggesting bears are in charge.
For a bullish continuation, the GBP/JPY must clear the 50-day SMA and extend its gains towards the March 30 high at 212.71, above the bearish flag support trendline, which is now turning into resistance. In that outcome, the next area of interest would be the March 26 high at 213.31.
On the other hand, a move lower beneath the March 31 swing low of 209.63 could open the door to challenge the year-to-date (YTD) low of 207.23. On further weakness, the 200-day SMA at 204.95 is up next.
GBP/JPY Price Chart – Daily
Japanese Yen Price This week
The table below shows the percentage change of Japanese Yen (JPY) against listed major currencies this week. Japanese Yen was the strongest against the US Dollar.
| USD | EUR | GBP | JPY | CAD | AUD | NZD | CHF | |
|---|---|---|---|---|---|---|---|---|
| USD | -0.77% | -0.35% | -0.90% | -0.07% | -0.87% | -0.04% | -0.31% | |
| EUR | 0.77% | 0.42% | -0.18% | 0.70% | -0.11% | 0.73% | 0.46% | |
| GBP | 0.35% | -0.42% | -0.53% | 0.27% | -0.54% | 0.30% | -0.00% | |
| JPY | 0.90% | 0.18% | 0.53% | 0.85% | 0.07% | 0.88% | 0.52% | |
| CAD | 0.07% | -0.70% | -0.27% | -0.85% | -0.83% | 0.02% | -0.28% | |
| AUD | 0.87% | 0.11% | 0.54% | -0.07% | 0.83% | 0.84% | 0.53% | |
| NZD | 0.04% | -0.73% | -0.30% | -0.88% | -0.02% | -0.84% | -0.31% | |
| CHF | 0.31% | -0.46% | 0.00% | -0.52% | 0.28% | -0.53% | 0.31% |
The heat map shows percentage changes of major currencies against each other. The base currency is picked from the left column, while the quote currency is picked from the top row. For example, if you pick the Japanese Yen from the left column and move along the horizontal line to the US Dollar, the percentage change displayed in the box will represent JPY (base)/USD (quote).
Author

Christian Borjon Valencia
FXStreet
Markets analyst, news editor, and trading instructor with over 14 years of experience across FX, commodities, US equity indices, and global macro markets.

















