Eurozone flash Manufacturing PMI rises faster-than-expected to 51.3 in June: What it means for EUR/USD?

Eurozone’s flash Manufacturing Purchasing Managers’ Index (PMI) arrives at 51.3 in June, higher than 51.2 estimates, but lower than 51.6 in May. The overall business activity has improved significantly, but remained in the contraction phase. A figure below 50.0 is considered as contraction in the business activity.
The Composite PMI in the oldest continent comes in higher at 49.5, against 49.1 estimates and the previous reading of 48.5. Meanwhile, the Services PMI also jumped to 48.9 from thr prior release of 47.7.
“The eurozone economy is showing enough resilience to just about stay out of recession. The flash PMI registered only a slight drop in business activity in June, meaning the survey is indicative of unchanged GDP over the second quarter. “There is welcome news of an easing in the recent downturn in services activity, with tourism and leisure related industries seeing signs of recovering demand after the initial disruptions from the war in the Middle East," Chris Williamson, Chief Business Economist at S&P Global Market Intelligence said.
Higher-than-expected Eurozone HCOB PMI data for June has offered some support to the Euro (EUR), which was facing selling pressure after the German flash PMI data release. However, it is difficult to ascertain whether it will hold the immediate cushion. At press time, EUR/USD trades close to its 10-month low of 1.1410.
Euro Price Today
The table below shows the percentage change of Euro (EUR) against listed major currencies today. Euro was the strongest against the Australian Dollar.
| USD | EUR | GBP | JPY | CAD | AUD | NZD | CHF | |
|---|---|---|---|---|---|---|---|---|
| USD | 0.11% | 0.15% | -0.15% | 0.10% | 0.74% | 0.43% | 0.05% | |
| EUR | -0.11% | 0.02% | -0.28% | -0.03% | 0.59% | 0.30% | -0.06% | |
| GBP | -0.15% | -0.02% | -0.28% | -0.03% | 0.59% | 0.28% | -0.07% | |
| JPY | 0.15% | 0.28% | 0.28% | 0.23% | 0.86% | 0.55% | 0.17% | |
| CAD | -0.10% | 0.03% | 0.03% | -0.23% | 0.64% | 0.33% | -0.04% | |
| AUD | -0.74% | -0.59% | -0.59% | -0.86% | -0.64% | -0.28% | -0.66% | |
| NZD | -0.43% | -0.30% | -0.28% | -0.55% | -0.33% | 0.28% | -0.38% | |
| CHF | -0.05% | 0.06% | 0.07% | -0.17% | 0.04% | 0.66% | 0.38% |
The heat map shows percentage changes of major currencies against each other. The base currency is picked from the left column, while the quote currency is picked from the top row. For example, if you pick the Euro from the left column and move along the horizontal line to the US Dollar, the percentage change displayed in the box will represent EUR (base)/USD (quote).
What does the better-than-projected Eurozone HCOB PMI data mean for EUR/USD?
Private sector business activity data in the old continent remains a key driver for the Euro. An improvement in the PMI data allows European Central Bank (ECB) policymakers to address inflation issues without remaining majorly concerned about economic risks. Upbeat Eurozone PMI data bodes well for the major currency. However, the data is unlikely to support EUR/USD in the near term, as the US Dollar (USD) is outperforming across the board due to firm expectations that the next monetary policy move by the Federal Reserve (Fed) will be on the upside.
Technical Analysis: EUR/USD trades near horizontal edge of Descending Triangle pattern
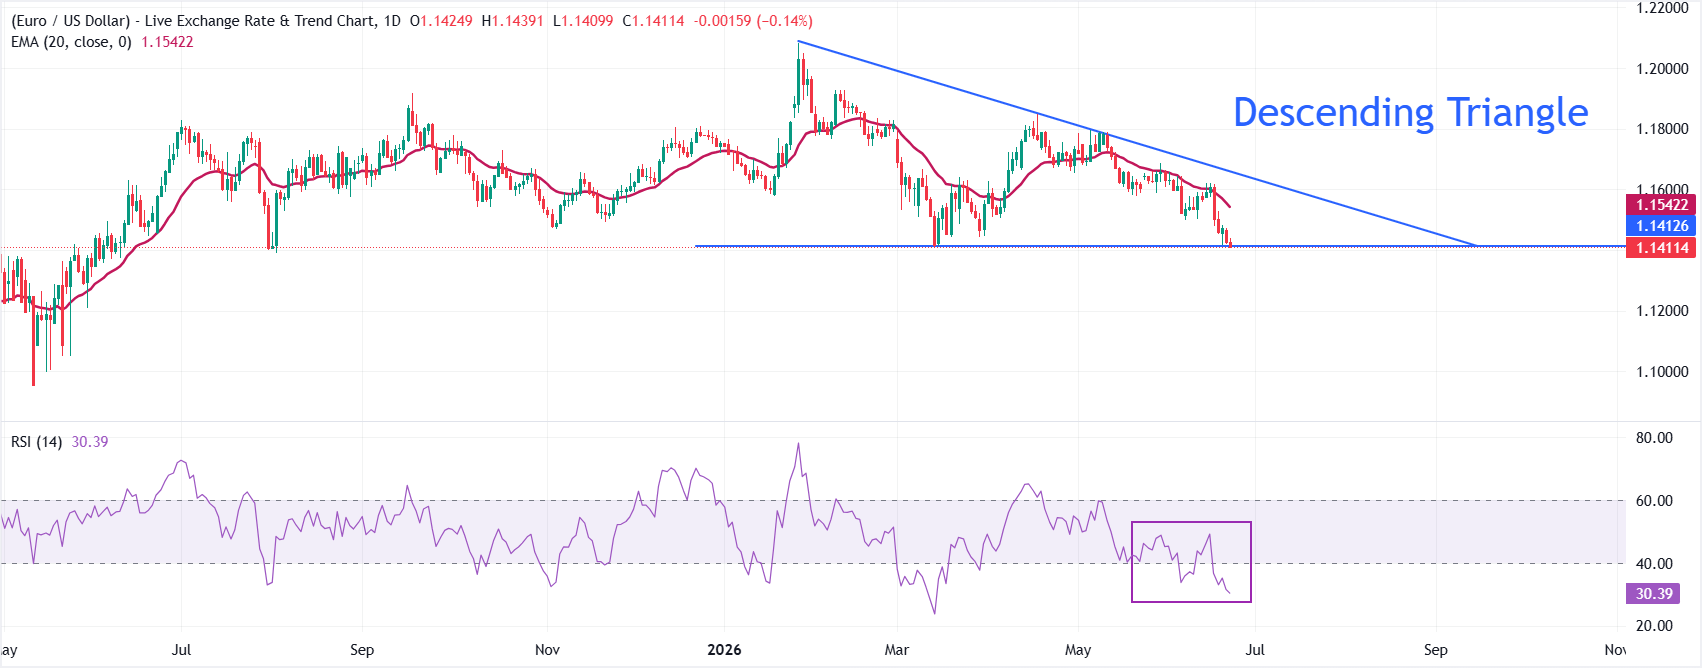
Bias: EUR/USD trades lower at around 1.1410, keeping a clear bearish bias as spot holds well beneath the 20-day Exponential Moving Average (EMA) at 1.1542. The pair trades close to the horizontal edge of the Descending Triangle pattern.
Momentum: The Relative Strength Index (RSI) at 30 is hovering just above oversold territory, hinting that downside momentum is stretched but not yet signaling a sustained recovery while price action remains pinned below these overhead technical barriers.
Support: Looking down, the pair could slide to the 4 June 2025 low at 1.1357 if it fails to hold the horizontal edge of the Descending Triangle pattern at around 1.1410.
Resistance: On the topside, initial resistance emerges at the 20-day EMA near 1.1542, and a stronger cap is reinforced by the former descending trend line acting as resistance around 1.1658, where sellers are likely to reassert control on any corrective bounce.
(The technical analysis of this story was written with the help of an AI tool.)
Economic Indicator
HCOB Manufacturing PMI
The Manufacturing Purchasing Managers Index (PMI), released on a monthly basis by S&P Global and Hamburg Commercial Bank (HCOB), is a leading indicator gauging business activity in the Eurozone manufacturing sector. The data is derived from surveys of senior executives at private-sector companies from the manufacturing sector. Survey responses reflect the change, if any, in the current month compared to the previous month and can anticipate changing trends in official data series such as Gross Domestic Product (GDP), industrial production, employment and inflation. The index varies between 0 and 100, with levels of 50.0 signaling no change over the previous month. A reading above 50 indicates that the manufacturing economy is generally expanding, a bullish sign for the Euro (EUR). Meanwhile, a reading below 50 signals that activity among goods producers is generally declining, which is seen as bearish for EUR.
Read more.Last release: Tue Jun 23, 2026 08:00 (Prel)
Frequency: Monthly
Actual: 51.3
Consensus: 51.2
Previous: 51.6
Source: S&P Global
Author

Sagar Dua
FXStreet
Sagar Dua is associated with the financial markets from his college days. Along with pursuing post-graduation in Commerce in 2014, he started his markets training with chart analysis.