EUR/USD Price Forecast: Symmetrical Triangle formation near bottom triggers reversal hopes
- EUR/USD rises to near 1.1560 as Iran’s confirmation of receiving the US ceasefire proposal has improved the market mood.
- The USD Index slides below 100.00 as its safe-haven demand diminishes.
- Iran clarifies that it won’t reopen Hormuz in exchange of temporary ceasefire.

The EUR/USD pair trades 0.4% higher to near 1.1560 during the European trading session on Monday. The major currency pair strengthens as market sentiment turns favorable toward riskier assets, such as the Euro (EUR), following confirmation from Iran that it has received the United States' (US) ceasefire proposal through Pakistan.
An improvement in investors’ risk appetite has diminished the safe-haven demand of the US Dollar (USD). During the press time, the US Dollar Index (DXY), which tracks the Greenback’s value against six major currencies, is down almost 0.4% to near 99.80. The USD Index was steady above 100.00 in the Asian trade.
US Dollar Price Today
The table below shows the percentage change of US Dollar (USD) against listed major currencies today. US Dollar was the weakest against the New Zealand Dollar.
| USD | EUR | GBP | JPY | CAD | AUD | NZD | CHF | |
|---|---|---|---|---|---|---|---|---|
| USD | -0.34% | -0.38% | -0.16% | -0.19% | -0.48% | -0.53% | -0.31% | |
| EUR | 0.34% | -0.02% | 0.15% | 0.16% | -0.16% | -0.18% | 0.00% | |
| GBP | 0.38% | 0.02% | 0.17% | 0.15% | -0.12% | -0.18% | 0.05% | |
| JPY | 0.16% | -0.15% | -0.17% | -0.01% | -0.32% | -0.38% | -0.16% | |
| CAD | 0.19% | -0.16% | -0.15% | 0.00% | -0.28% | -0.35% | -0.12% | |
| AUD | 0.48% | 0.16% | 0.12% | 0.32% | 0.28% | -0.07% | 0.17% | |
| NZD | 0.53% | 0.18% | 0.18% | 0.38% | 0.35% | 0.07% | 0.24% | |
| CHF | 0.31% | -0.01% | -0.05% | 0.16% | 0.12% | -0.17% | -0.24% |
The heat map shows percentage changes of major currencies against each other. The base currency is picked from the left column, while the quote currency is picked from the top row. For example, if you pick the US Dollar from the left column and move along the horizontal line to the Japanese Yen, the percentage change displayed in the box will represent USD (base)/JPY (quote).
Though Iran has acknowledged the receipt of the ceasefire proposal, it has clarified that there will be no acceptance of the proposal under pressure or deadlines. Tehran has also stated that it will not reopen the Strait of Hormuz, a passage to 20% of global oil supply, in exchange for a 'temporary ceasefire'.
On the macro front, investors await the US ISM Services PMI data for March, which will be published at 14:00 GMT. The Services PMI is expected to arrive at 55.0, lower than the previous reading of 56.1.
This week, major highlights will be the US Federal Open Market Committee (FOMC) minutes of the March policy meeting and the Consumer Price Index (CPI) data for March, which will be released on Wednesday and Friday, respectively.
EUR/USD technical analysis
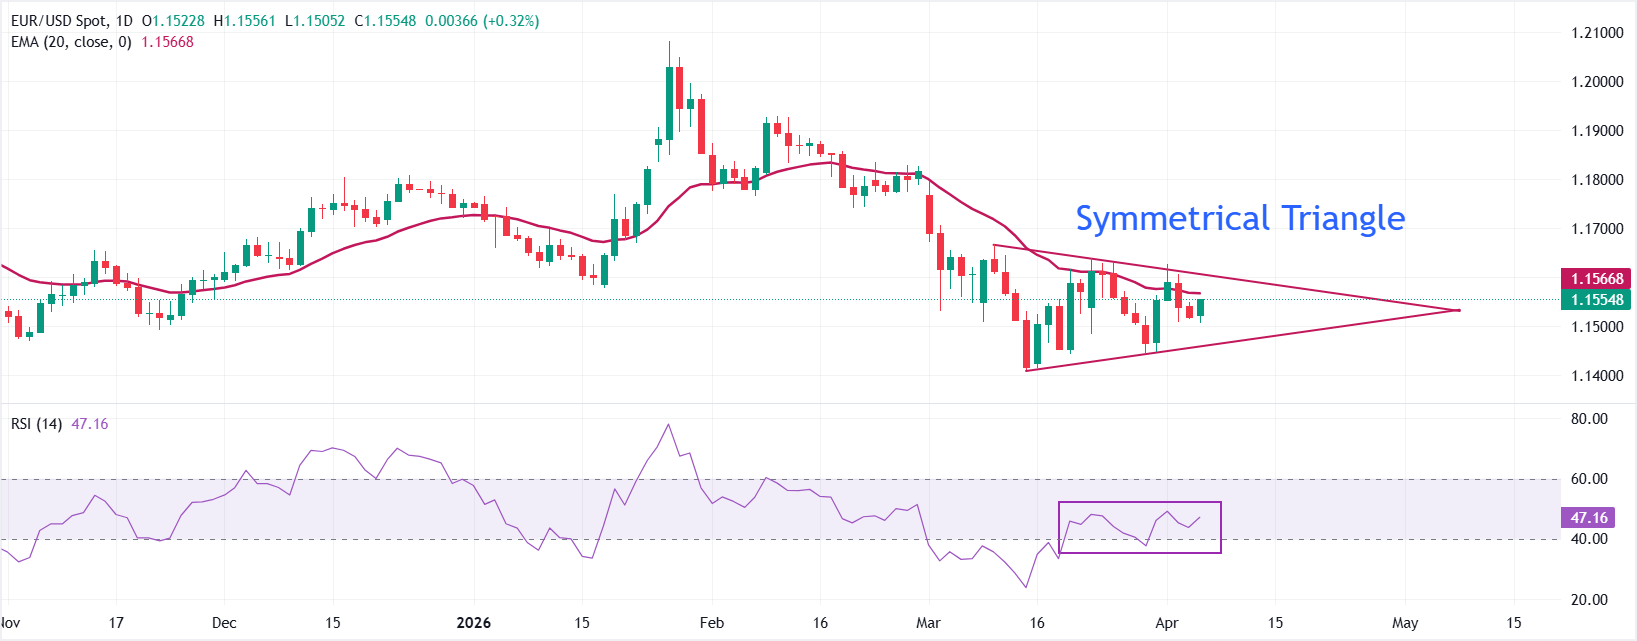
EUR/USD trades higher at around 1.1560 at the press time. The pair sits just below the 20-day Exponential Moving Average (EMA) near 1.1570, keeping a mild bearish bias in place while price remains capped beneath this dynamic barrier. A symmetrical triangle formation on the bottom level suggests that the broader trend has turned sideways, and a bullish reversal could be around the corner.
The 14-day Relative Strength Index (RSI) range shift move into the 40.00-60.00 zone from territory below 40.00 signifies cooling upside momentum, with bullish bias remaining in place.
Initial resistance emerges at the 20-day EMA around 1.1570, followed by the descending trend-line region near 1.1600, where repeated failures have formed a tight cap on the upside. A close above that zone would weaken the bearish stance and open the way toward 1.1660. On the downside, immediate support is located at the rising trend line from 1.1408, now intersecting around 1.1500, with a break there exposing the late-1.14 area as the next bearish target. A sustained move below 1.1450 would confirm a deeper downside extension within the prevailing daily downtrend towards the March low at 1.1411.
(The technical analysis of this story was written with the help of an AI tool.)
US Dollar FAQs
The US Dollar (USD) is the official currency of the United States of America, and the ‘de facto’ currency of a significant number of other countries where it is found in circulation alongside local notes. It is the most heavily traded currency in the world, accounting for over 88% of all global foreign exchange turnover, or an average of $6.6 trillion in transactions per day, according to data from 2022. Following the second world war, the USD took over from the British Pound as the world’s reserve currency. For most of its history, the US Dollar was backed by Gold, until the Bretton Woods Agreement in 1971 when the Gold Standard went away.
The most important single factor impacting on the value of the US Dollar is monetary policy, which is shaped by the Federal Reserve (Fed). The Fed has two mandates: to achieve price stability (control inflation) and foster full employment. Its primary tool to achieve these two goals is by adjusting interest rates. When prices are rising too quickly and inflation is above the Fed’s 2% target, the Fed will raise rates, which helps the USD value. When inflation falls below 2% or the Unemployment Rate is too high, the Fed may lower interest rates, which weighs on the Greenback.
In extreme situations, the Federal Reserve can also print more Dollars and enact quantitative easing (QE). QE is the process by which the Fed substantially increases the flow of credit in a stuck financial system. It is a non-standard policy measure used when credit has dried up because banks will not lend to each other (out of the fear of counterparty default). It is a last resort when simply lowering interest rates is unlikely to achieve the necessary result. It was the Fed’s weapon of choice to combat the credit crunch that occurred during the Great Financial Crisis in 2008. It involves the Fed printing more Dollars and using them to buy US government bonds predominantly from financial institutions. QE usually leads to a weaker US Dollar.
Quantitative tightening (QT) is the reverse process whereby the Federal Reserve stops buying bonds from financial institutions and does not reinvest the principal from the bonds it holds maturing in new purchases. It is usually positive for the US Dollar.
Author

Sagar Dua
FXStreet
Sagar Dua is associated with the financial markets from his college days. Along with pursuing post-graduation in Commerce in 2014, he started his markets training with chart analysis.














