EUR/USD Price Forecast: Consolidates below key Fibonacci level as bulls defend 200-day SMA
- EUR/USD rises as the US Dollar weakens amid possible Japanese FX intervention.
- Technically, EUR/USD holds above the 200-day SMA on the daily chart, keeping a mild bullish bias.
- The pair struggles below the 50% Fibonacci retracement at 1.1747.

The Euro (EUR) edges higher against the US Dollar (USD) on Thursday as the Greenback softens broadly following possible intervention from Tokyo, with authorities seen selling Dollars to support the Japanese Yen (JPY), while the Euro also draws some support from the latest monetary policy decision by the European Central Bank (ECB).
At the time of writing, EUR/USD is trading around 1.1726, up nearly 0.42%. Meanwhile, the US Dollar Index (DXY), which tracks the Greenback’s value against a basket of six major currencies, is trading around 98.16, down about 0.80% on the day.
The European Central Bank left all three key interest rates unchanged, in line with expectations. The bank said the Middle East conflict is pushing energy prices higher, lifting inflation while weighing on growth. Policymakers reiterated that they will closely monitor incoming data and maintain a data-dependent approach, while remaining committed to ensuring inflation stabilizes at the 2% target in the medium term.
Earlier in the day, preliminary data showed that the Harmonized Index of Consumer Prices (HICP) rose 3% YoY in April, accelerating from 2.6% in March and marking the highest level since September 2023, largely driven by energy prices.
ECB President Christine Lagarde said a rate hike was discussed extensively and the decision to hold was unanimous. Markets are pricing in two to three rate hikes this year, though traders remain cautious about whether the central bank can hike aggressively given the Eurozone’s exposure to energy shocks.
Technical Analysis:
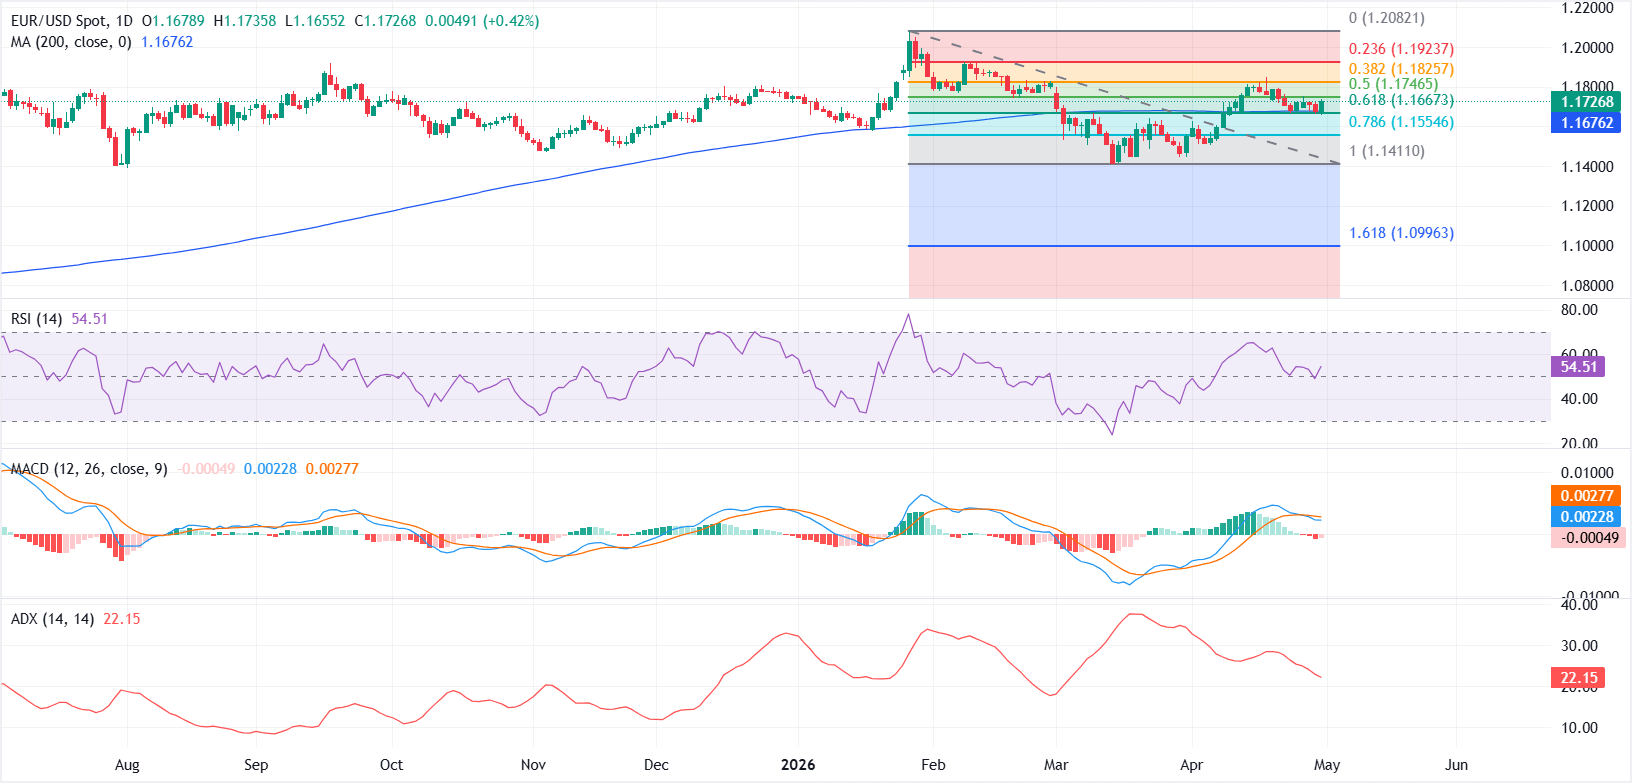
In the daily chart, EUR/USD holds above the 200-day Simple Moving Average (SMA) at 1.1676, keeping a mild bullish bias while it consolidates just under the 50.0% Fibonacci retracement at 1.1747 of the move from the January high to the March low. The Relative Strength Index (14) at 54.4 leans slightly positive without signalling overbought conditions, whereas the Moving Average Convergence Divergence (MACD) has slipped marginally into negative territory, hinting that upside momentum is losing some traction as the broader trend strength, reflected by an Average Directional Index (ADX) near 22.2, remains modest.
On the topside, immediate resistance is located at the 50.0% Fibonacci retracement at 1.1747; a sustained break higher would open the door toward the 38.2% retracement at 1.1826, followed by the 23.6% level at 1.1924. On the downside, initial support is seen at the 200-day SMA at 1.1676, closely backed by the 61.8% Fibonacci level at 1.1667, while deeper losses would expose the 78.6% retracement at 1.1555 ahead of the 100.0% Fibonacci anchor near 1.1411.
(The technical analysis of this story was written with the help of an AI tool.)
(This story was corrected on April 30 at 18:33 GMT to say, in the first paragraph, that the EUR edges higher against the USD on Thursday, not Tuesday.)
Euro Price Today
The table below shows the percentage change of Euro (EUR) against listed major currencies today. Euro was the strongest against the US Dollar.
| USD | EUR | GBP | JPY | CAD | AUD | NZD | CHF | |
|---|---|---|---|---|---|---|---|---|
| USD | -0.45% | -0.87% | -2.53% | -0.62% | -1.05% | -1.19% | -1.24% | |
| EUR | 0.45% | -0.39% | -2.11% | -0.18% | -0.58% | -0.72% | -0.77% | |
| GBP | 0.87% | 0.39% | -1.70% | 0.21% | -0.19% | -0.33% | -0.39% | |
| JPY | 2.53% | 2.11% | 1.70% | 1.96% | 1.54% | 1.34% | 1.31% | |
| CAD | 0.62% | 0.18% | -0.21% | -1.96% | -0.44% | -0.59% | -0.62% | |
| AUD | 1.05% | 0.58% | 0.19% | -1.54% | 0.44% | -0.14% | -0.17% | |
| NZD | 1.19% | 0.72% | 0.33% | -1.34% | 0.59% | 0.14% | -0.05% | |
| CHF | 1.24% | 0.77% | 0.39% | -1.31% | 0.62% | 0.17% | 0.05% |
The heat map shows percentage changes of major currencies against each other. The base currency is picked from the left column, while the quote currency is picked from the top row. For example, if you pick the Euro from the left column and move along the horizontal line to the US Dollar, the percentage change displayed in the box will represent EUR (base)/USD (quote).
Author

Vishal Chaturvedi
FXStreet
I am a macro-focused research analyst with over four years of experience covering forex and commodities market. I enjoy breaking down complex economic trends and turning them into clear, actionable insights that help traders stay ahead of the curve.















