EUR/USD Price Forecast: 20-day EMA acts as key barrier, sees more downside below 1.1400
- EUR/USD declines to near 1.1535 as the US Dollar gains amid Middle East conflicts.
- Iran vows to retaliate against Trump’s 48-hour ultimatum.
- The ECB could deliver interest rate hikes in the next two policy meetings.
The EUR/USD pair weakens as the US Dollar (USD) trades higher due to escalating Middle East conflicts, trading 0.3% lower to near 1.1535 during the European trading session on Monday. The US Dollar gains as Middle East conflicts, which involve the United States (US), Israel, and Iran, have increased the demand for safe-haven assets.
At the press time, the US Dollar Index (DXY), which tracks the Greenback’s value against six major currencies, trades 0.35% higher to near 99.90.
Conflicts in the Middle East have escalated as Iran vows the indefinite closure of the Strait of Hormuz and attacks on regional infrastructure belonging to the US and Israel against President Donald Trump’s 48-hour ultimatum.
Over the weekend, US President Trump threatened attacks on Tehran’s power plants through a post on Truth.Social, if it doesn’t open Hormuz within the next 48 hours.
Meanwhile, the Euro (EUR) trades lower as surging energy prices in the Eurozone are expected to diminish households’ purchasing power. On the monetary policy front, Goldman Sachs expects the European Central Bank (ECB) to raise interest rates in April and the June policy meetings. Last week, the ECB left interest rates unchanged.
EUR/USD technical analysis
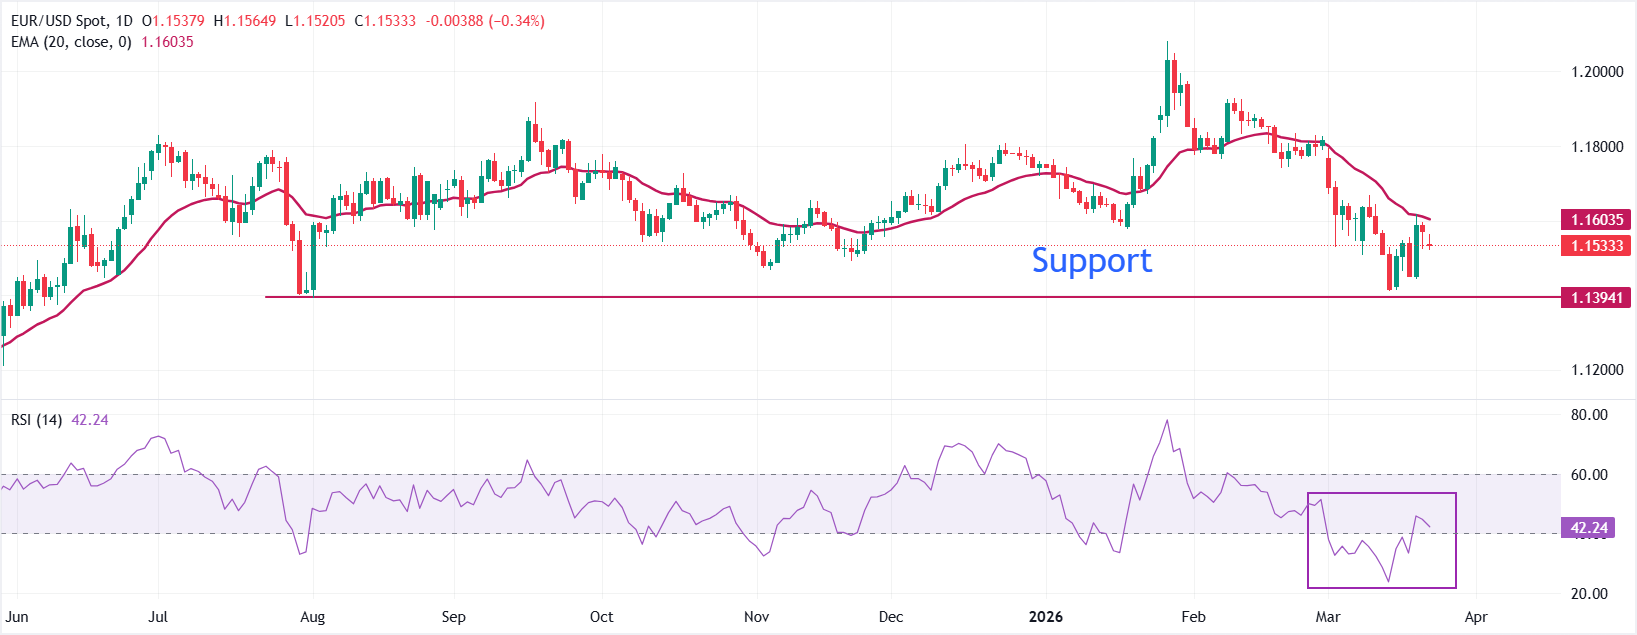
EUR/USD trades lower at around 1.1535 as of writing. The near-term bias is bearish as spot holds below the descending 20-day Exponential Moving Average (EMA), which is around 1.1600 and acting as dynamic resistance after the recent breakdown from the mid-1.16 area. Price action has set a sequence of lower highs and lower closes from the 1.18 zone, while the RSI at 42 remains below the 50 midline, confirming persistent downside momentum rather than a completed correction.
Initial resistance emerges at the 20-day EMA, followed by the March 10 high of 1.1667. A daily close above the latter would be needed to challenge the broader bearish structure. On the downside, immediate support sits at 1.1500, guarding the recent low at 1.1415; a break below 1.1415 would open the way toward the 1.1350 region as the next bearish target zone.
(The technical analysis of this story was written with the help of an AI tool.)
(This story was corrected at 09:30 GMT to say in the title that EUR/USD Price Forecast: 20-day EMA acts as key barrier, sees more downside below 1.1400, and not 1.3400)
belonging
Author

Sagar Dua
FXStreet
Sagar Dua is associated with the financial markets from his college days. Along with pursuing post-graduation in Commerce in 2014, he started his markets training with chart analysis.
















