EUR/JPY Price Forecast: The next bullish target to watch is above 162.50
- EUR/JPY drifts higher to near 162.00 in Wednesday’s early European session.
- The cross maintains a negative outlook below the 100-period EMA, with a bearish RSI indicator.
- The potential resistance level emerges at 162.70; the initial downside target to watch is 161.17.

The EUR/JPY cross holds positive ground around 162.00 during the early European session on Thursday. A record of Japan’s trade deficit data weighs on the Japanese Yen (JPY) and creates a tailwind for EUR/JPY. Japan’s Merchandise Trade Balance fell into a deficit of ¥621.84 billion after maintaining a surplus in June as imports climbed faster than expected.
Later on Thursday, traders will focus on the preliminary Purchasing Managers’ Index (PMI) for August from Germany and the Eurozone. On the Japanese docket, the National Consumer Price Index (CPI) for July and the Bank of Japan (BoJ) Governor Ueda's speech will be closely watched.
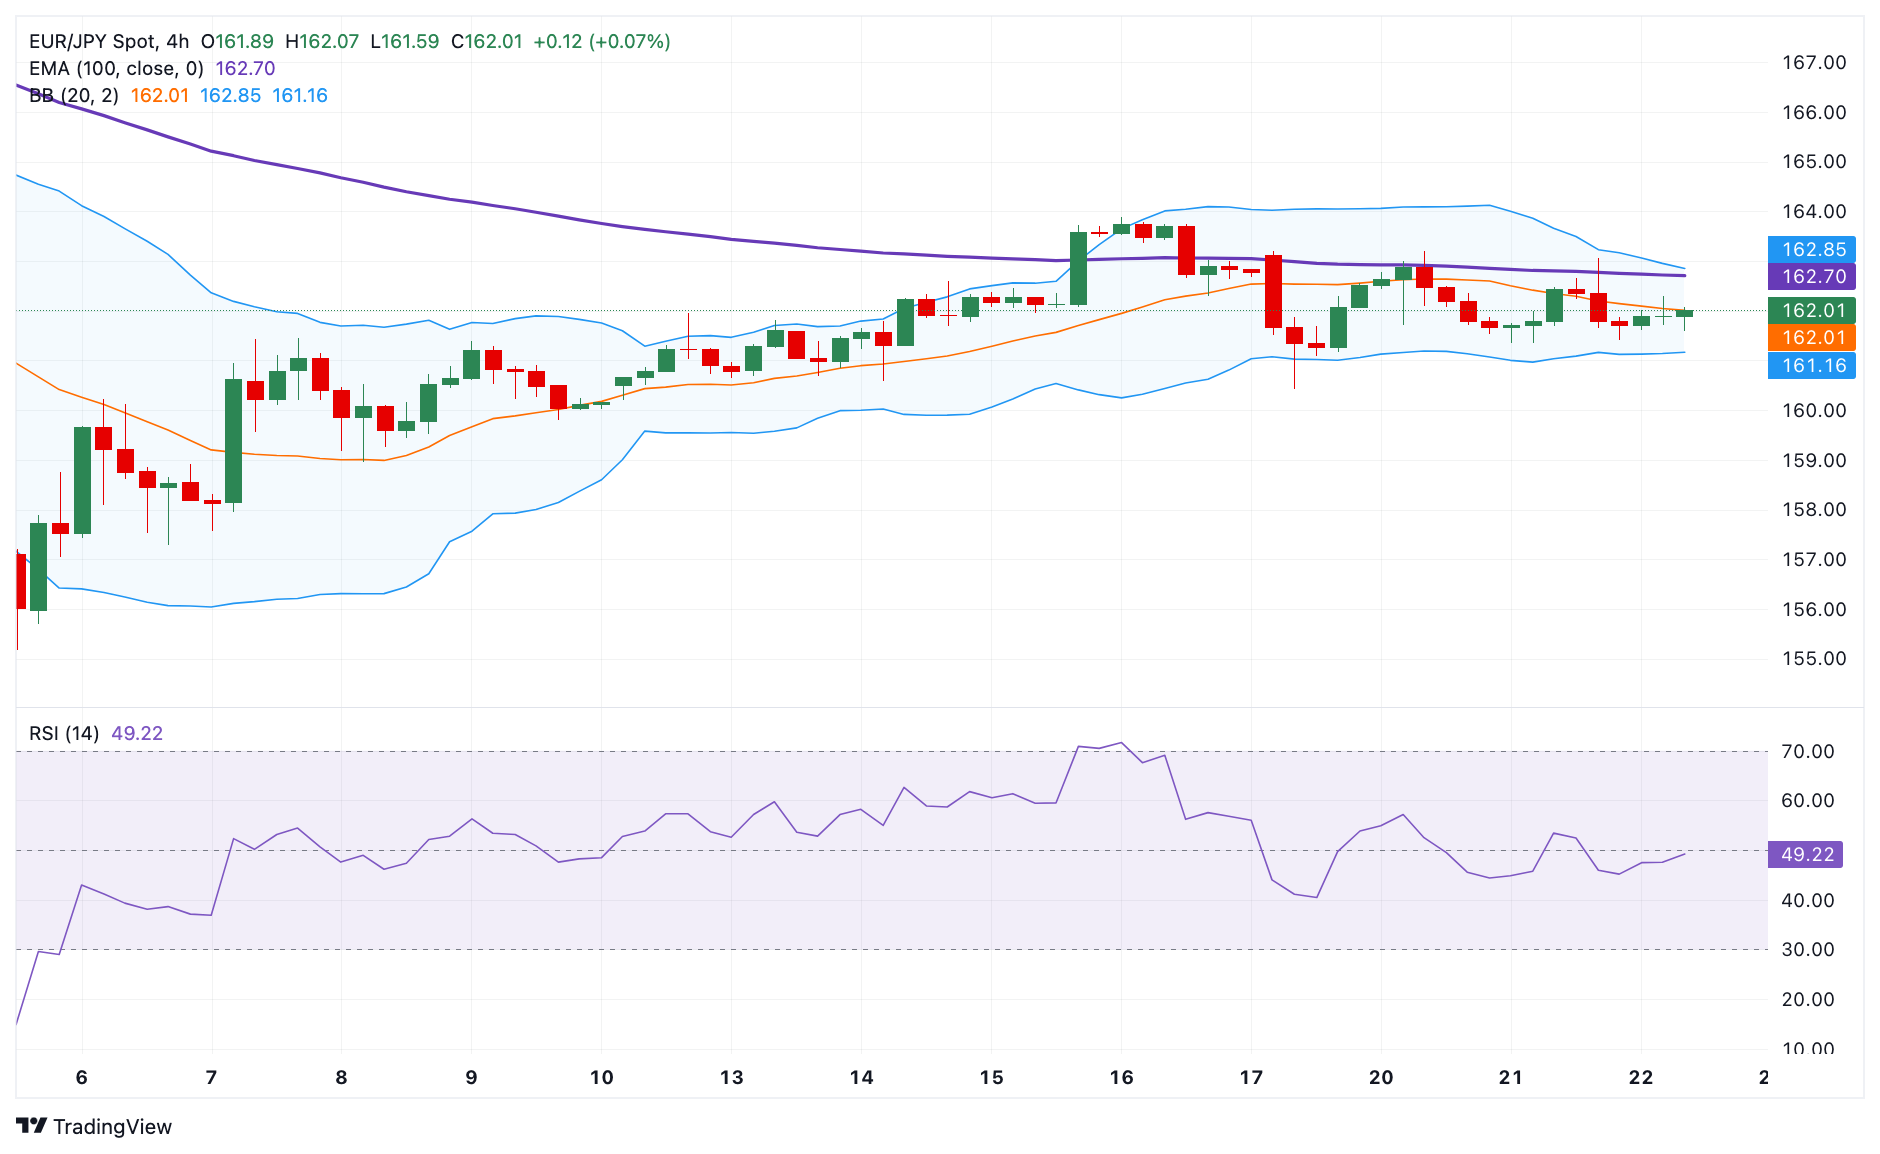
EUR/JPY keeps the bearish vibe unchanged on the 4-hour chart as the cross is currently below the key 100-period Exponential Moving Averages (EMA). Additionally, the Relative Strength Index (RSI) stands below the midline near 48.00, suggesting that there could still be room for further downward movement in the near term.
The 100-period EMA at 162.70 acts as an immediate resistance level for the cross. Extended gains could expose 162.85, the upper boundary of the Bollinger Band. The additional upside filter to watch is 163.75, the high of August 16.
On the flip side, the first downside target emerges at 161.17, the lower limit of the Bollinger Band. A breach of this level could pave the way to 160.42, the low of August 19. The next contention level is located at 159.91, the low of August 9.
EUR/JPY 4-hour chart
Euro FAQs
The Euro is the currency for the 20 European Union countries that belong to the Eurozone. It is the second most heavily traded currency in the world behind the US Dollar. In 2022, it accounted for 31% of all foreign exchange transactions, with an average daily turnover of over $2.2 trillion a day. EUR/USD is the most heavily traded currency pair in the world, accounting for an estimated 30% off all transactions, followed by EUR/JPY (4%), EUR/GBP (3%) and EUR/AUD (2%).
The European Central Bank (ECB) in Frankfurt, Germany, is the reserve bank for the Eurozone. The ECB sets interest rates and manages monetary policy. The ECB’s primary mandate is to maintain price stability, which means either controlling inflation or stimulating growth. Its primary tool is the raising or lowering of interest rates. Relatively high interest rates – or the expectation of higher rates – will usually benefit the Euro and vice versa. The ECB Governing Council makes monetary policy decisions at meetings held eight times a year. Decisions are made by heads of the Eurozone national banks and six permanent members, including the President of the ECB, Christine Lagarde.
Eurozone inflation data, measured by the Harmonized Index of Consumer Prices (HICP), is an important econometric for the Euro. If inflation rises more than expected, especially if above the ECB’s 2% target, it obliges the ECB to raise interest rates to bring it back under control. Relatively high interest rates compared to its counterparts will usually benefit the Euro, as it makes the region more attractive as a place for global investors to park their money.
Data releases gauge the health of the economy and can impact on the Euro. Indicators such as GDP, Manufacturing and Services PMIs, employment, and consumer sentiment surveys can all influence the direction of the single currency. A strong economy is good for the Euro. Not only does it attract more foreign investment but it may encourage the ECB to put up interest rates, which will directly strengthen the Euro. Otherwise, if economic data is weak, the Euro is likely to fall. Economic data for the four largest economies in the euro area (Germany, France, Italy and Spain) are especially significant, as they account for 75% of the Eurozone’s economy.
Another significant data release for the Euro is the Trade Balance. This indicator measures the difference between what a country earns from its exports and what it spends on imports over a given period. If a country produces highly sought after exports then its currency will gain in value purely from the extra demand created from foreign buyers seeking to purchase these goods. Therefore, a positive net Trade Balance strengthens a currency and vice versa for a negative balance.
Author

Lallalit Srijandorn
FXStreet
Lallalit Srijandorn is a Parisian at heart. She has lived in France since 2019 and now becomes a digital entrepreneur based in Paris and Bangkok.


