EUR/GBP Price Forecast: Cross remains capped below Key SMAs despite tentative rebound
- EUR/GBP trades choppy on Thursday as resilient UK GDP data supports the Pound while UK political uncertainty limits gains.
- Traders price in at least two rate hikes from both the ECB and BoE amid persistent Oil-driven inflation risks tied to Middle East disruptions.
- Technically, EUR/GBP remains capped below the 50-day and 200-day SMAs, keeping the near-term bias tilted to the downside.

EUR/GBP trades choppy on Thursday, with the British Pound (GBP) modestly outperforming the Euro (EUR) on the back of resilient UK economic data, while traders also assess growing political noise in the United Kingdom. At the time of writing, the cross is trading around 0.8659 after touching an intraday high of 0.8668 earlier in the day.
The UK economy expanded by 1.1% YoY in the first quarter of 2026, accelerating from 1% in the previous quarter and beating market expectations of 0.8%, according to preliminary estimates. On a monthly basis, UK GDP rose 0.3% in March, defying forecasts for a 0.2% contraction, though growth slowed slightly from February’s 0.4% expansion.
However, the GBP is struggling to build on gains from the stronger UK economic data as political uncertainty weighs on sentiment. Speculation over potential leadership challenges to Prime Minister Keir Starmer has intensified following the Labour Party’s weak performance in recent local elections. UK Health Secretary Wes Streeting, who is viewed as a leading contender to replace Starmer, resigned from the government on Thursday.
Meanwhile, investor attention also remains focused on the monetary policy outlook for the European Central Bank (ECB) and the Bank of England (BoE) amid Oil-driven inflation risks stemming from ongoing disruptions in the Middle East. Traders are now pricing in at least two interest rate hikes from both central banks by the end of the year.
The Euro is failing to benefit from rising hawkish ECB bets as the Eurozone is viewed as more vulnerable to the ongoing energy shock due to its heavier reliance on imported energy, raising concerns about slowing economic growth. The prospect that the ECB may face greater difficulty in raising interest rates is keeping the near-term bias in EUR/GBP tilted to the downside.
Technical Analysis:
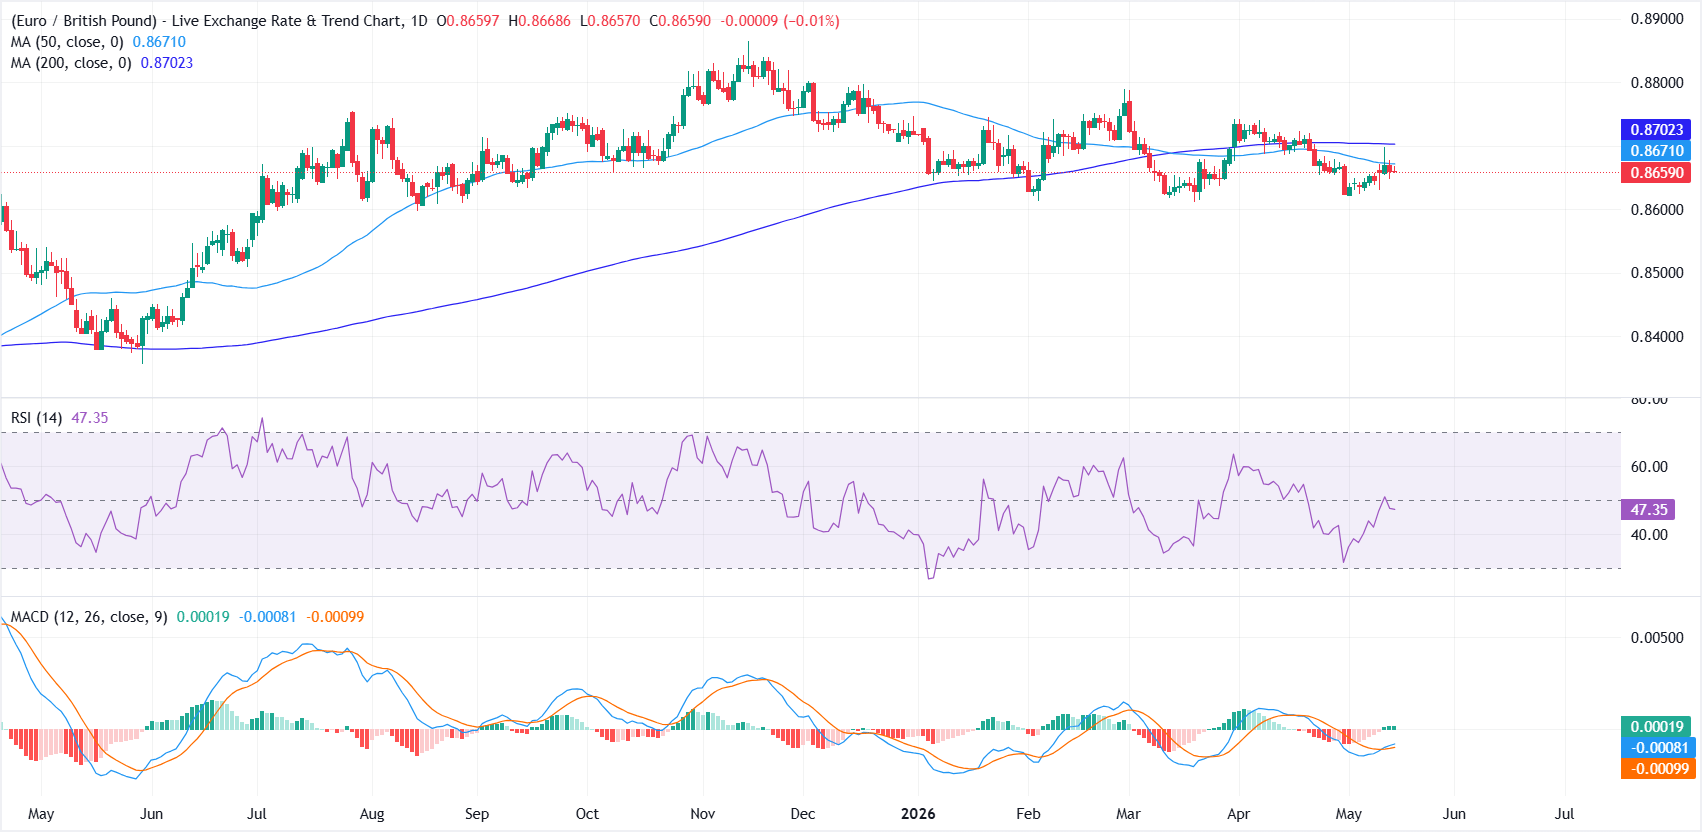
In the daily chart, EUR/GBP keeps a mildly bearish near-term tone as it holds beneath both the 50-day Simple Moving Average (SMA) at 0.8671 and the 200-day SMA at 0.8702. The pair is consolidating below these overlapping trend filters, suggesting rallies remain constrained for now, while the Relative Strength Index (RSI) near 48 stays neutral-to-soft and a slightly positive Moving Average Convergence Divergence (MACD) reading hints at only tentative upside momentum.
On the topside, initial resistance emerges at the 50-day SMA around 0.8671, with a stronger cap aligned at the 200-day SMA near 0.8702, where sellers could reassert control if the cross attempts a recovery. With no clear support levels from major averages below spot, any further downside would leave EUR/GBP vulnerable to probing lower swing areas, keeping the broader risk skewed toward additional weakness while price remains under the aforementioned moving averages.
(The technical analysis of this story was written with the help of an AI tool.)
Pound Sterling Price Today
The table below shows the percentage change of British Pound (GBP) against listed major currencies today. British Pound was the strongest against the Australian Dollar.
| USD | EUR | GBP | JPY | CAD | AUD | NZD | CHF | |
|---|---|---|---|---|---|---|---|---|
| USD | 0.12% | 0.11% | 0.06% | 0.12% | 0.35% | 0.14% | -0.02% | |
| EUR | -0.12% | -0.03% | -0.07% | -0.01% | 0.18% | -0.02% | -0.14% | |
| GBP | -0.11% | 0.03% | -0.04% | 0.02% | 0.23% | 0.00% | -0.08% | |
| JPY | -0.06% | 0.07% | 0.04% | 0.04% | 0.27% | 0.05% | -0.09% | |
| CAD | -0.12% | 0.00% | -0.02% | -0.04% | 0.24% | -0.00% | -0.09% | |
| AUD | -0.35% | -0.18% | -0.23% | -0.27% | -0.24% | -0.21% | -0.28% | |
| NZD | -0.14% | 0.02% | 0.00% | -0.05% | 0.00% | 0.21% | -0.10% | |
| CHF | 0.02% | 0.14% | 0.08% | 0.09% | 0.09% | 0.28% | 0.10% |
The heat map shows percentage changes of major currencies against each other. The base currency is picked from the left column, while the quote currency is picked from the top row. For example, if you pick the British Pound from the left column and move along the horizontal line to the US Dollar, the percentage change displayed in the box will represent GBP (base)/USD (quote).
Author

Vishal Chaturvedi
FXStreet
I am a macro-focused research analyst with over four years of experience covering forex and commodities market. I enjoy breaking down complex economic trends and turning them into clear, actionable insights that help traders stay ahead of the curve.
















