|

EUR/GBP Price Analysis: Bears show no mercy and push the cross to lows since 2022

  • EUR/GBP extended its downtrend on Monday, declining by 0.50% to 0.8335.
  • The breach below 0.8350 marked a low since April 2022.
  • The RSI has entered the oversold territory, while the MACD signals increasing bearish momentum.

The EUR/GBP pair continued its downward streak on Monday, declining by 0.50% to 0.8335, its lowest level since April 2022. The selling pressure remains relentless, and the technical indicators signal a negative trend, supporting the bearish outlook.

On the daily chart, the Relative Strength Index (RSI) has entered the oversold territory, with a value of 28. This sharp decline indicates that selling pressure is rising. The Moving Average Convergence Divergence (MACD) histogram remains red and rising, also suggesting increasing bearish momentum. 

EUR/GBP daily chart
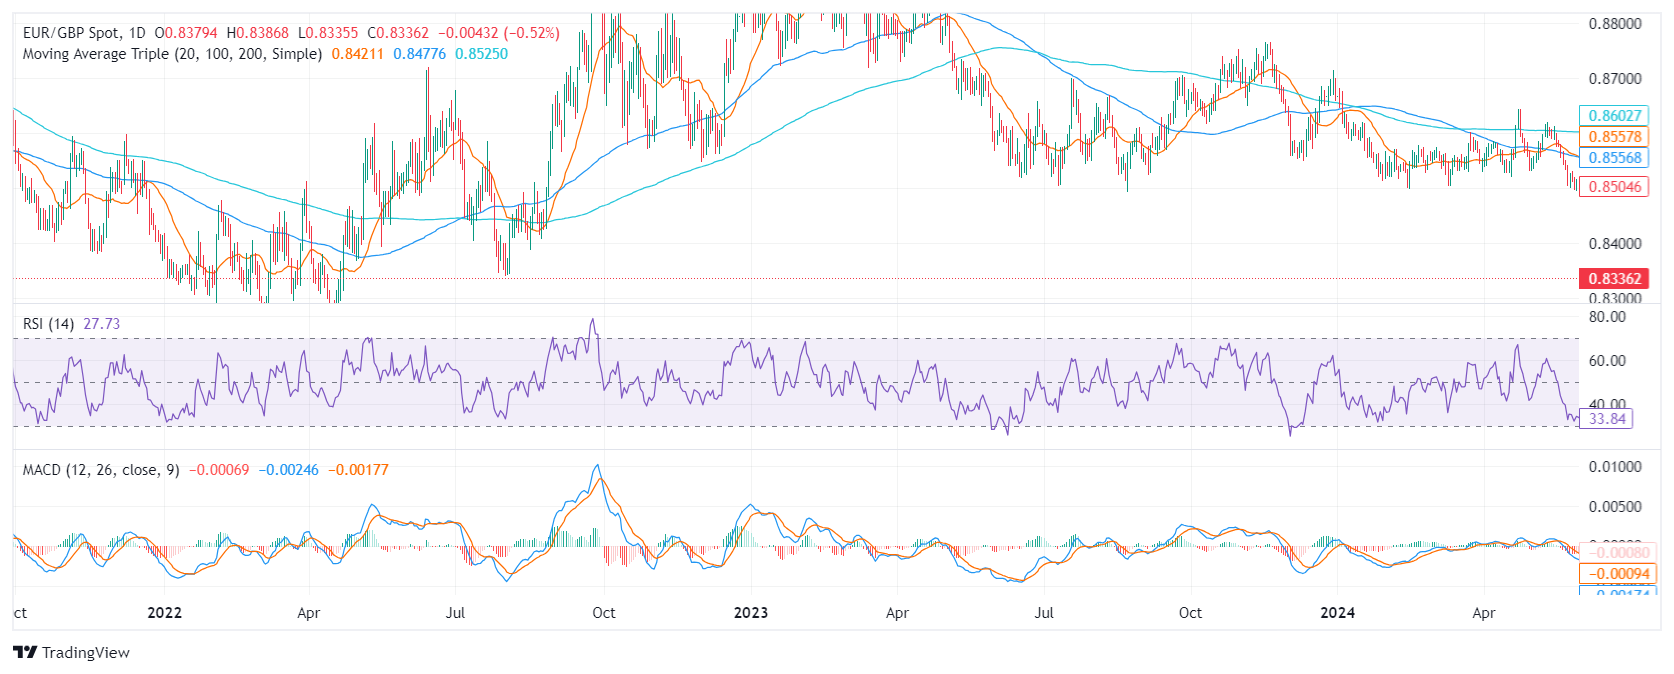
Based on the current technical picture, the EUR/GBP pair is likely to continue its downward trajectory. That being said, indicators entering oversold conditions may suggest that an upward correction may be incoming in the next session as sellers may take a breather to consolidate gains.

Support levels: 0.8330, 0.8310, 0.8300
Resistance levels: 0.8350, 0.8400, 0.8430

Author

Patricio Martín

Patricio is an economist from Argentina passionate about global finance and understanding the daily movements of the markets.


More from Patricio Martín
Share:

Editor's Picks

GBP/USD moves away from multi-week top as Hormuz risks support the Dollar

The GBP/USD pair edges lower at the start of a new week and moves further away from an over three-week high, or levels just above the 1.3500 psychological mark touched on Friday.

EUR/USD consolidates below 1.1600 amid Mideast tensions

EUR/USD kicks off the new week on a subdued note and trades below 1.1600 in the European morning on Monday, well within striking distance of a fresh high since June 17, touched in reaction to the disappointing US jobs data on Friday.

Gold appears 'buy-the-dip' trade before the US inflation test

Gold is moving further away from seven-week highs of $4,372 early Monday, approaching $4,300. The US Dollar recovers from the post-US NFP slump amid renewed Hormuz risks. Gold remains a ‘buy-the-dip’ trade on the daily chart ahead of the US CPI data

AI defies the disinflationary playbook: Why lower oil prices might not be enough to cool core inflation
The global economic landscape has been fixated on the Middle East since the US-Iran war started in late February, reacting to significant changes in crude Oil prices and assessing how they could influence inflation dynamics and growth outlook.
Cardano: Bulls eye a second leg higher as whales buy

Cardano (ADA) trades above $0.196 at the start of the week after posting double-digit gains over the past two weeks. ADA’s bullish price action is supported by steady whale accumulation. Meanwhile, derivatives sentiment is showing a slight bullish tilt, suggesting a second leg higher for ADA.

9-3: Is the Federal Reserve’s vote tally Warsh's new forward guidance?
The rate did not move. Neither did the statement, and that’s the more interesting fact. Set the July 29 Federal Open Market Committee (FOMC) statement beside the one issued on June 17, and the two documents are identical apart from a single verb and a paragraph at the bottom naming three dissenters.














