|

Elliott Wave view: QQQ correcting cycle from May 18 [Video]

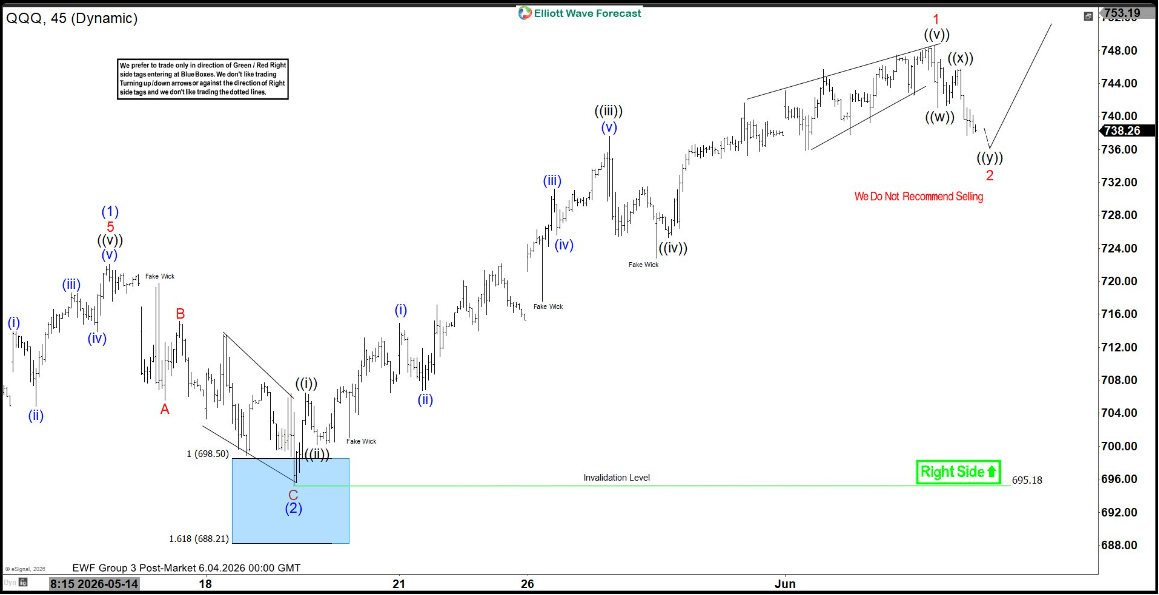
The Nasdaq 100 ETF (QQQ) established a significant low on March 31, 2026, at $555.55. From this level, the ETF advanced in wave (1), reaching $722.03, before a corrective pullback in wave (2) concluded at $695.25. The subsequent rally unfolded as wave (3), structured as a clear impulsive Elliott Wave sequence. Within this move, wave ((i)) terminated at $706.49, followed by wave ((ii)) at $700.20. Momentum then carried wave ((iii)) to $737.60, before wave ((iv)) corrected to $725.27. The final leg, wave ((v)), extended to $748.65, completing wave 1 of the higher degree cycle.

At present, QQQ is pulling back in wave 2, correcting the cycle from the May 19, 2026 low. This phase has already produced wave ((w)), which ended at $741.01, and a counter‑trend rally in wave ((x)), which peaked at $745.76. Market expectations now center on wave ((y)) finding support between $733.60 and $738.20. Once this support zone is confirmed, wave 2 should conclude, paving the way for the next upward cycle. Near term, the pivot at $695.18 remains critical. As long as this level holds, dips are expected to attract buyers. The correction may unfold in 3, 7, or 11 swings, but the broader structure favors continuation higher once the corrective rhythm stabilizes.

Nasdaq 100 ETF (QQQ) 45-minute Elliott Wave chart

Nasdaq 100 ETF Elliott Wave [Video]

Youtube preview

Author

Elliott Wave Forecast Team

Elliott Wave Forecast Team

ElliottWave-Forecast.com

More from Elliott Wave Forecast Team
Share:

Editor's Picks

AUD/USD eyes 0.7150 barrier nine-day EMA

AUD/USD inches higher after registering modest losses in the previous day, trading around 0.7130 during the Asian hours. The technical analysis of the daily chart indicates that the pair is moving sideways within the rectangle pattern, suggesting a consolidation as neither the bulls nor the bears have enough momentum to take control of the market.

USD/JPY trades below 160.00 intervention threshold; bullish bias intact

The USD/JPY pair attracts some sellers during the Asian session amid fears that authorities will step in again to prop up the Japanese Yen. Furthermore, the Israel-Lebanon truce prompts some profit-taking around the US Dollar and exerts downward pressure on the currency pair.

Gold defends 200-day SMA at $4,425, but for how long?

Gold is attempting a tepid recovery toward $4,500 early Thursday, as renewed optimism in the Mideast geopolitical front calms market nerves. This cautious optimism across Asian markets weighs on Oil prices, and diminishes the US Dollar’s safe-haven appeal, helping Gold stage a decent comeback from the weekly low of $4,424.


Hyperliquid: ETF demand, capital rotation fuel HYPE rally as Bitcoin melts

Hyperliquid price sustains an upward trend near its all-time high of $75.76 on Thursday after posting 80% gains in May, while Bitcoin (BTC) retraces below $65,000, triggering a market-wide panic.

Kevin Warsh takes the Fed helm: What it means for the US Dollar
The Federal Reserve moves away from the highly predictable "forward guidance" model of the Jerome Powell era to a new “Kevin Warsh environment”, characterized by less communication, more policy surprises, and an increased focus on the Fed's complex balance sheet.
Recession on paper: What really moves the Canadian Loonie now?

Statistics Canada handed the headline writers a gift and the analysts a headache. Real GDP shrank 0.1% on an annualized basis in the first quarter, and with the fourth quarter of 2025 revised down to a 1.0% contraction, that is two negative quarters in a row, the textbook definition of a technical recession and Canada's first since the pandemic.