|

Elliott Wave view: Nvidia (NVDA) looking for a double correction [Video]

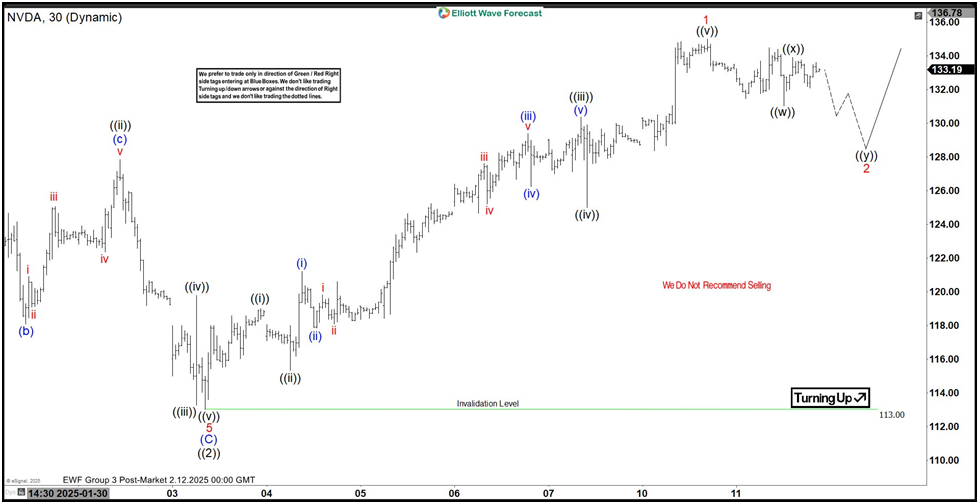
Short term Elliott Wave suggests the all-time high in Nvidia (NVDA) at 152.89 ended wave ((1)). Dips in wave ((2)) unfolded as an expanded Flat. Down from wave ((1)), wave (A) ended at 128.22 and wave (B) ended at 153.13. Down from there, wave 1 ended at 129.11 and wave 2 ended at 149.1. Wave 3 lower ended at 116.7 and wave 4 ended at 131.99. Wave 5 lower ended at 113 which completed wave (C) of ((2)) in higher degree. The 30 minutes chart below shows the pullback in wave ((2)).

The stock has turned higher in wave ((3)), but it still needs to break above wave ((1)) peak at 152.89 to rule out any double correction. Up from wave ((2)), wave ((i)) ended at 119 and pullback in wave ((ii)) ended at 115.33. The stock rallied higher in wave ((iii)) towards 130.37 and dips in wave ((iv)) ended at 125. Final leg wave ((v)) ended at 135 which completed wave 1. Wave 2 pullback is now in progress to correct cycle from 2.3.2025 low in 3, 7, or 11 swing before the next leg higher. Near term, as far as pivot at 113 low stays intact, expect pullback to find support in 3, 7, 11 swing for more upside.

Nvidia (NVDA) 30 minutes Elliott Wave chart
Chart

NVDA [Video]

Author

Elliott Wave Forecast Team

Elliott Wave Forecast Team

ElliottWave-Forecast.com

More from Elliott Wave Forecast Team
Share:

Editor's Picks

GBP/USD stays below 1.3400 after soft UK CPI data

GBP/USD struggles to gain traction and stays below 1.3400 in the second half of the day on Wednesday. The UK annual Consumer Price Index (CPI) inflation cooled to 2.6% in June against the market forecast of 2.7%, making it difficult for the British Pound gather recovery momentum. Meanwhile, investors keep a close eye on headlines coming out of the Middle East.

EUR/USD stabilizes near 1.1400 as markets focus on geopolitics

EUR/USD trades in a narrow channel at around 1.1400 on Wednesday. In the absence of high-impact data releases, escalating geopolitical tensions in the Middle East caps the pair's upside. On Thursday, the European Central Bank (ECB) will announce monetary policy decisions.

Gold holds gains above $4,100 undaunted by risk-off markets

Gold extends gains for the fourth consecutive day, standing comfortably above $4,100, unfazed by the risk-off market amid rising tensions in Iran and higher Oil prices. The pair has rallied nearly 2.5% so far this week and is on track for its best weekly performance in more than three months.

Cardano: Short-term recovery lacks retail support

Cardano price edges lower after the 50-day Exponential Moving Average at $1.770 capped two consecutive days of recovery seen earlier this week. ADA futures point to waning retail traction as Open Interest and trading volume decline amid elevated long liquidations. The technical outlook for ADA is bearish, as momentum remains subdued below a resistance trendline near $0.1782.

Chip stocks are more volatile than Oil

I continue to start the day by looking at these two charts: US crude & Kospi. The former is extending gains, trading above $86 per barrel for WTI and $92 per barrel for Brent, while the Kospi is up more than 4.5%, led higher by Korean chipmakers following a similar jump in VanEck's Semiconductor ETF yesterday.

US Dollar mid-year outlook: Exceptional currency, exceptional risks?
The US Dollar enters the second half of 2026 in a markedly different position from a year ago. The King currency has recovered, reflecting persistent US inflation, changing expectations for Fed policy, geopolitical tensions and renewed demand for defensive assets.