Dow Jones Industrial Average surrenders a record as the Fed turns hawkish
- DJIA reversed from a fresh intraday record to trade lower after the June Federal Reserve decision.
- New projections flipped the 2026 rate path from a cut to a hike.
- Rising Treasury yields hit rate-sensitive and growth stocks hardest.

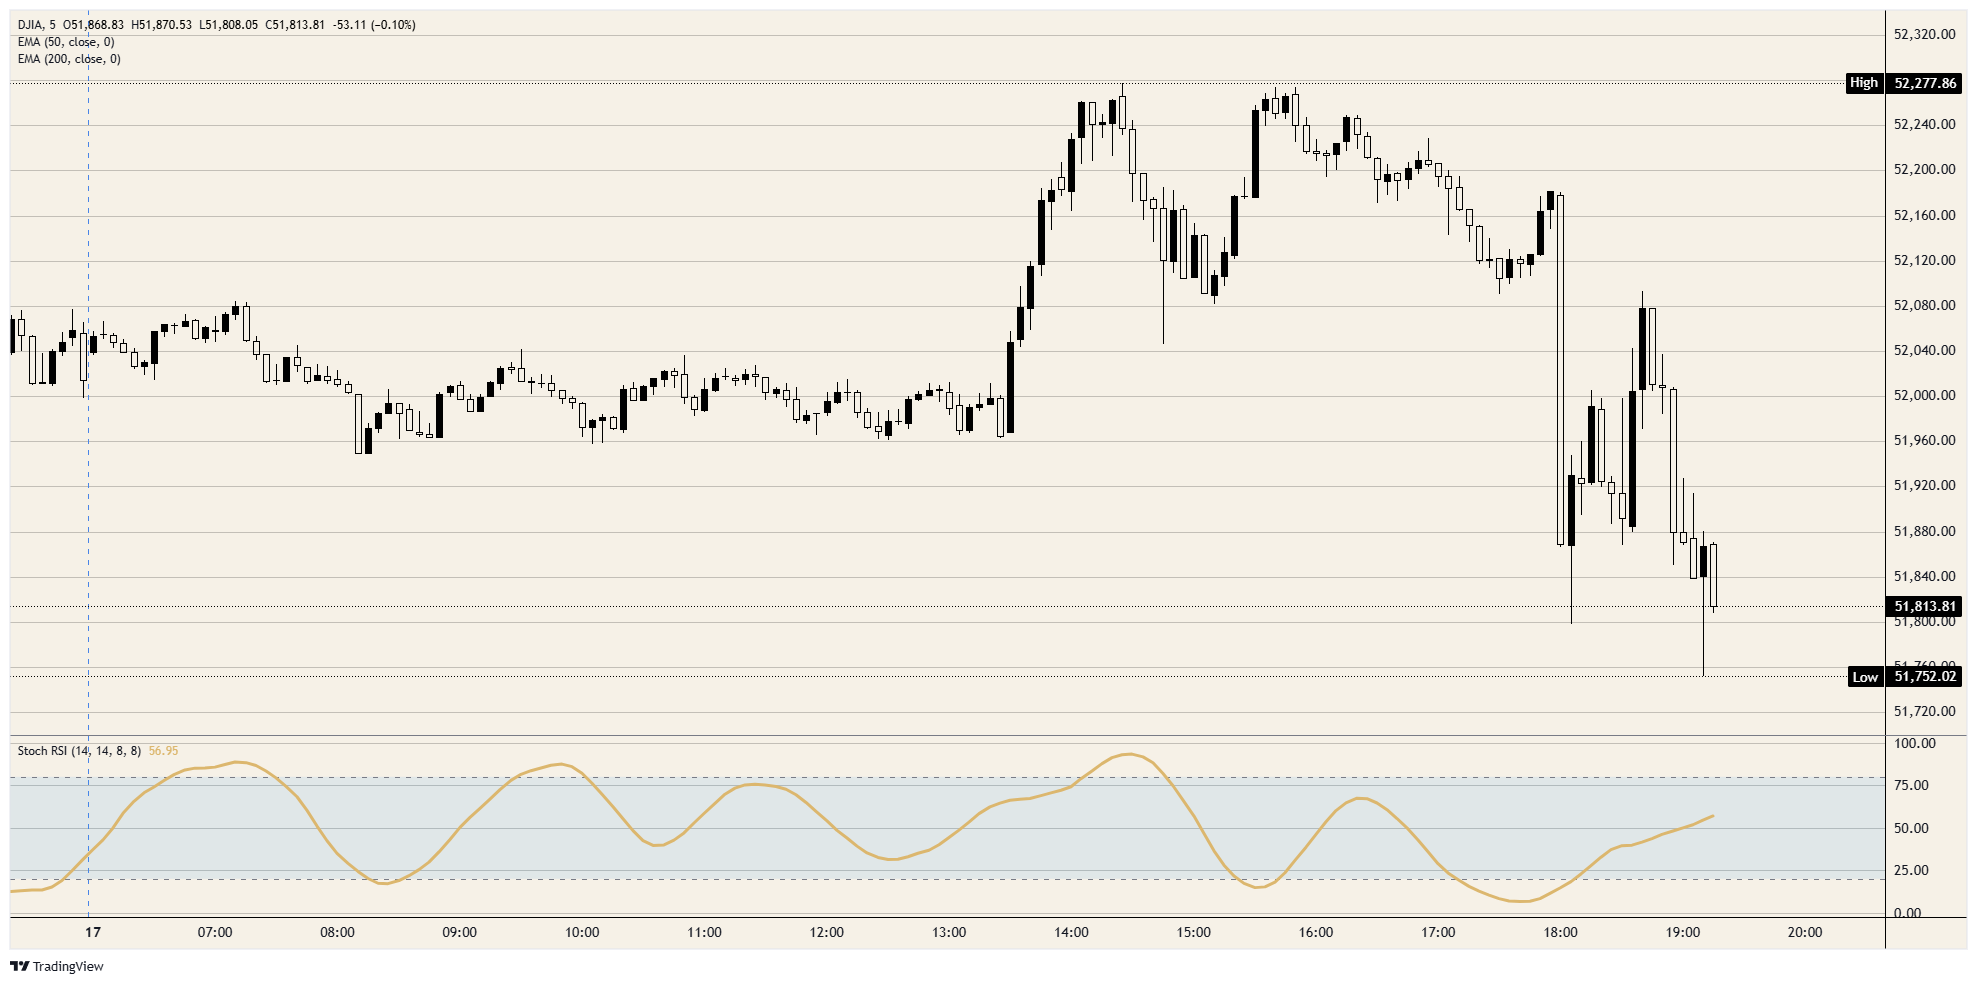
The Dow Jones Industrial Average (DJIA) spent Wednesday morning printing another record, its third in a row, before running headlong into Kevin Warsh's first decision as Federal Reserve (Fed) Chair. The hold itself surprised no one, but the hawkish projections stapled to it did, and the index reversed hard. It surrendered its gains and slid to a session low near 51,800, roughly 480 points off its intraday high, before steadying modestly lower on the day.
A statement with no hedge
The Federal Open Market Committee (FOMC) left the target range at 3.50% to 3.75% on a unanimous 12 to 0 vote, a clean break from the fractured 8 to 4 split in April. The easing bias was deleted and swapped for a flat pledge to deliver price stability, while job gains were upgraded and policymakers highlighted strong productivity and investment. For an equity market that had been leaning on the prospect of cuts, the removal of that cushion was the unwelcome part.
Dots that point up
The Summary of Economic Projections (SEP) did the damage. The median 2026 federal funds projection jumped to roughly 3.8% from 3.4% in March, flipping the next move from a cut to a hike, after the median 2026 Personal Consumption Expenditures (PCE) inflation projection blew out to 3.6% from 2.7%. The 2-year Treasury yield rose about 11 basis points to near 4.16% on the release, and that jump in rates, rather than the hold itself, is what equities were forced to digest.
Warsh swings the gavel
At his first press conference Warsh wasted little time asserting himself, launching five task forces to review how the Fed runs key operations, including the balance sheet. He leaned hardest into communication, saying he would not be surprised if the Fed adopts a new communications framework and changes the SEP by year-end, a strong hint that he wants to wean the central bank off forward guidance and, with it, the dot plot that just rattled equities. Stocks carved out their lows as he spoke before paring some of the damage.
Where the pain landed
The selling concentrated where higher rates bite hardest. Rate-sensitive growth names led the retreat, with the technology-heavy Nasdaq Composite and the small-cap Russell 2000 both down close to 1% at their worst, while the higher-for-longer backdrop the Fed just endorsed tends to favor financials over long-duration growth. The data offered no excuse for the Fed to relent either, with retail sales up a strong 0.9% in May, and even a pullback in oil on the new Iran deal failed to cool a central bank now worried about price pressure beyond energy.
Resistance: 52,000 caps the index after the breakdown, and the record high near 52,300 is the level bulls must reclaim to argue the reversal was just noise.
Support: The session low near 51,800 is the first floor, and a break there exposes 51,500 and turns a one-day pullback into something more serious.
Bias: Lower. Higher yields and a Fed that has dropped any pretense of cutting are a direct headwind for equities, and the failed record breakout argues for caution while the index trades back below 52,000.
Dow Jones 5-minute chart
Dow Jones FAQs
The Dow Jones Industrial Average, one of the oldest stock market indices in the world, is compiled of the 30 most traded stocks in the US. The index is price-weighted rather than weighted by capitalization. It is calculated by summing the prices of the constituent stocks and dividing them by a factor, currently 0.152. The index was founded by Charles Dow, who also founded the Wall Street Journal. In later years it has been criticized for not being broadly representative enough because it only tracks 30 conglomerates, unlike broader indices such as the S&P 500.
Many different factors drive the Dow Jones Industrial Average (DJIA). The aggregate performance of the component companies revealed in quarterly company earnings reports is the main one. US and global macroeconomic data also contributes as it impacts on investor sentiment. The level of interest rates, set by the Federal Reserve (Fed), also influences the DJIA as it affects the cost of credit, on which many corporations are heavily reliant. Therefore, inflation can be a major driver as well as other metrics which impact the Fed decisions.
Dow Theory is a method for identifying the primary trend of the stock market developed by Charles Dow. A key step is to compare the direction of the Dow Jones Industrial Average (DJIA) and the Dow Jones Transportation Average (DJTA) and only follow trends where both are moving in the same direction. Volume is a confirmatory criteria. The theory uses elements of peak and trough analysis. Dow’s theory posits three trend phases: accumulation, when smart money starts buying or selling; public participation, when the wider public joins in; and distribution, when the smart money exits.
There are a number of ways to trade the DJIA. One is to use ETFs which allow investors to trade the DJIA as a single security, rather than having to buy shares in all 30 constituent companies. A leading example is the SPDR Dow Jones Industrial Average ETF (DIA). DJIA futures contracts enable traders to speculate on the future value of the index and Options provide the right, but not the obligation, to buy or sell the index at a predetermined price in the future. Mutual funds enable investors to buy a share of a diversified portfolio of DJIA stocks thus providing exposure to the overall index.
Author

Joshua Gibson
FXStreet
Joshua joins the FXStreet team as an Economics and Finance double major from Vancouver Island University with twelve years' experience as an independent trader focusing on technical analysis.


