Dow Jones Industrial Average surges as Trump halts Iran strikes, Oil plunges
- Stocks rallied broadly after President Trump announced a five-day halt to strikes on Iranian energy infrastructure.
- Oil prices plunged with Brent and WTI both falling more than 7% on de-escalation hopes.
- Cyclical sectors led gains with industrials, banks, and airlines posting the strongest advances.

The Dow Jones Industrial Average (DJIA) surges more than 600 points on Monday, climbing roughly 1.5% to recapture the 46,000 handle as investors bet that the worst of the Iran crisis may be nearing an end. The S&P 500 rose around 1.4%, clawing back toward 6,600, while the Nasdaq Composite gained roughly 1.6%. All three indices had been threatening correction territory heading into the session, with the Dow and Nasdaq each sitting around 9.8% off their record highs through Friday.
Trump-Iran de-escalation triggers broad risk rally
The entire American market session was defined by a single Truth Social post: President Trump announced that the US and Iran had held "very good and productive conversations" over the weekend and that he had instructed what he called the Department of War to postpone all military strikes against Iranian power plants and energy infrastructure for five days. Prior to the post, futures had been pointing to another bruising session with Oil continuing to surge and equities under pressure.
Dow futures briefly jumped more than 1K points in the immediate aftermath. The rally cooled somewhat after Iranian state media denied that any direct talks had taken place between Washington and Tehran, pulling the major indices off their session highs. Still, the general read was that the administration's willingness to pause escalation was itself a meaningful signal, even if a comprehensive deal remains a long way off.
Oil craters on ceasefire hopes
The crude complex saw its most dramatic single-session reversal in weeks. West Texas Intermediate (WTI) futures tumbled roughly 8% to settle around $91 a barrel after hovering near $100 earlier in the day. International benchmark Brent plunged more than 7% to around $101, having touched above $114 during the Asian session before Trump's post. Even with Monday's selloff, both benchmarks remain more than a third above their pre-war levels from late February.
Goldman Sachs raised its near-term Oil price forecasts earlier in the day, expecting Brent to average above $100 through April, citing the ongoing effective closure of the Strait of Hormuz, which normally handles around 20% of global seaborne Oil trade. The International Energy Agency (IEA) also signalled readiness for another emergency release from strategic stockpiles if needed.
Cyclical stocks lead the rebound
It was a textbook risk-on day. Caterpillar (CAT) led the Dow with a gain of roughly 4%, followed by 3M (MMM) and Home Depot (HD), each up more than 3%. Banks caught a bid as Treasury yields pulled back, with JPMorgan (JPM) and Morgan Stanley (MS) both climbing. Airline stocks were among the session's biggest beneficiaries of the Oil selloff, with Delta Air Lines (DAL) and United Airlines (UAL) rallying sharply. In the mega-cap tech space, Tesla (TSLA) gained around 3%, while Nvidia (NVDA), Amazon (AMZN), and Apple (AAPL) each rose more than 2%, getting some relief after mixed guidance on artificial intelligence demand from chipmakers weighed on the group last week.
Rate cut expectations continue to evaporate
The Federal Reserve (Fed) held rates steady at 3.50%-3.75% at last week's Federal Open Market Committee (FOMC) meeting, its second consecutive hold after three 25-basis-point cuts closed out 2025. The updated dot plot now projects just one cut for the remainder of 2026, down from previous forecasts, and the CME FedWatch Tool shows how quickly the market has repriced. The probability of rates remaining unchanged through June has surged to 89% from under 38% just a month ago, and there is now a slim chance of a rate hike for the first time.
For the full year, markets see it as more likely than not that the Fed does not cut at all. Gold, typically a beneficiary of geopolitical stress, has instead been crushed by the shift in rate expectations, falling below $4,300 on Monday to its lowest level of 2026 as higher-for-longer rates reduce the appeal of the non-yielding metal.
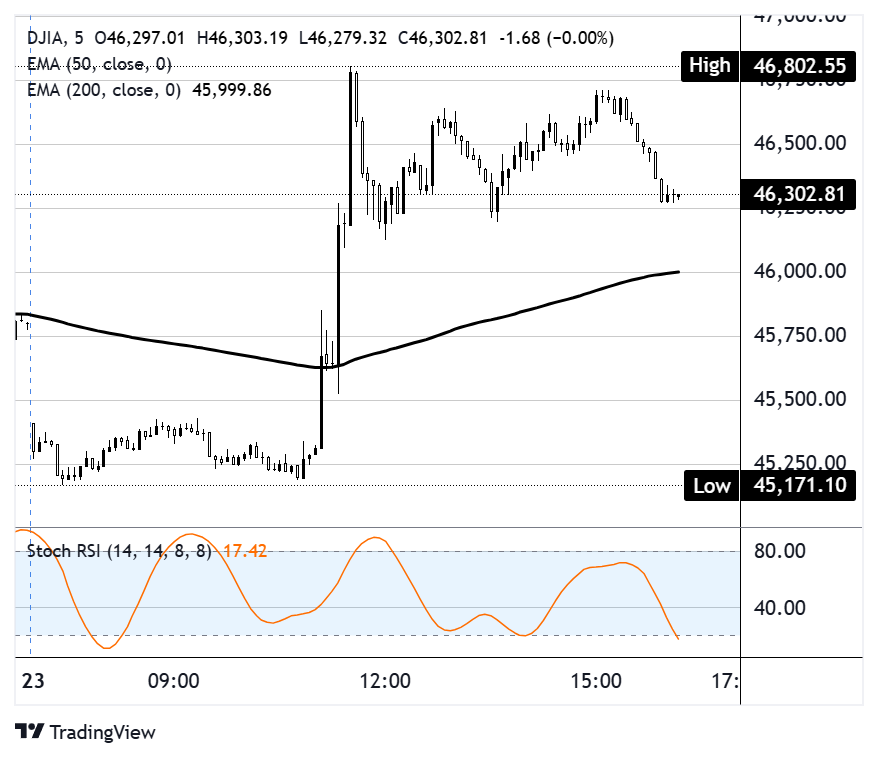
Dow Jones five-minute chart
Dow Jones FAQs
The Dow Jones Industrial Average, one of the oldest stock market indices in the world, is compiled of the 30 most traded stocks in the US. The index is price-weighted rather than weighted by capitalization. It is calculated by summing the prices of the constituent stocks and dividing them by a factor, currently 0.152. The index was founded by Charles Dow, who also founded the Wall Street Journal. In later years it has been criticized for not being broadly representative enough because it only tracks 30 conglomerates, unlike broader indices such as the S&P 500.
Many different factors drive the Dow Jones Industrial Average (DJIA). The aggregate performance of the component companies revealed in quarterly company earnings reports is the main one. US and global macroeconomic data also contributes as it impacts on investor sentiment. The level of interest rates, set by the Federal Reserve (Fed), also influences the DJIA as it affects the cost of credit, on which many corporations are heavily reliant. Therefore, inflation can be a major driver as well as other metrics which impact the Fed decisions.
Dow Theory is a method for identifying the primary trend of the stock market developed by Charles Dow. A key step is to compare the direction of the Dow Jones Industrial Average (DJIA) and the Dow Jones Transportation Average (DJTA) and only follow trends where both are moving in the same direction. Volume is a confirmatory criteria. The theory uses elements of peak and trough analysis. Dow’s theory posits three trend phases: accumulation, when smart money starts buying or selling; public participation, when the wider public joins in; and distribution, when the smart money exits.
There are a number of ways to trade the DJIA. One is to use ETFs which allow investors to trade the DJIA as a single security, rather than having to buy shares in all 30 constituent companies. A leading example is the SPDR Dow Jones Industrial Average ETF (DIA). DJIA futures contracts enable traders to speculate on the future value of the index and Options provide the right, but not the obligation, to buy or sell the index at a predetermined price in the future. Mutual funds enable investors to buy a share of a diversified portfolio of DJIA stocks thus providing exposure to the overall index.
Author

Joshua Gibson
FXStreet
Joshua joins the FXStreet team as an Economics and Finance double major from Vancouver Island University with twelve years' experience as an independent trader focusing on technical analysis.