Dow Jones Industrial Average climbs on Treasury declines, rate cut hopes
- The Dow Jones extended a bullish recovery on the back of rate cut hopes.
- US inflation remains above targets, but pressures may be easing slightly.
- Treasury yields are getting cheaper and rate cut bets are back on the rise.

The Dow Jones Industrial Average (DJIA) added over a full percentage point in value on Friday, climbing around 500 points and vaulting back over 43,500 as market expectations for further rate cuts increased. Tech stocks are back on the rise as traders pile back into their risk appetite ways, and the banking sector is broadly climbing after a wide swath of better-than-expected earnings reports from major investment banks this week.
The inauguration of US President Donald Trump will take place next week, on Monday, when US markets will be shuttered for Martin Luther King Day. Equities are poised to continue the exuberance train for the time being. Trump’s election night win in November sparked a massive rally as traders eyed a potential future with deregulation, lower taxes, and higher equity valuations.
Key inflation metrics gave just enough ground this week for Treasury yields to ease as investors look for signs of cooling inflation to reignite rate cut talk at the Federal Reserve (Fed). While some inflation segment accelerated recently, the figures overall came in below expectations, prompting markets to reassess the odds of a Fed rate trim in the first half of 2025.
According to the CME’s FedWatch Tool, rate markets are now seeing greater than even odds of a 25 bps rate cut in May, with a second rate cut expected in December. Investor hopes for rate cuts took a beating to kick off the new year, and equity traders needed to go through a tantrum period after hopes for four-plus rate cuts in 2025 disintegrated this December past.
Dow Jones news
Friday’s rally is firmly gripping the Dow Jones, with nearly every single listed security gaining ground for the day. Nvidia (NVDA) is back on the high side, climbing 3% and tapping $138 per share once again, with Salesforce (CRM) bumping another 2.5% higher to $328 per share.
Dow Jones price forecast
Bears just can’t have anything nice. The Dow Jones is back above the 50-day Exponential Moving Average (EMA), and bulls can now breathe a sigh of relief. The major equity index still has a long way to go to reclaim record highs set above 45,000 last December, but bidders will happily take a 4% gain in a single week.
Still, the near-term bull run cost a lot of ground on momentum oscillators, and buyers shouldn’t be surprised by any interim pullbacks as downside pressure turns elastic. The Dow Jones’ immediate technical floor is priced in at 42,000, but there’s still plenty of wiggle room at the 50-day EMA near 43,100.
Dow Jones daily chart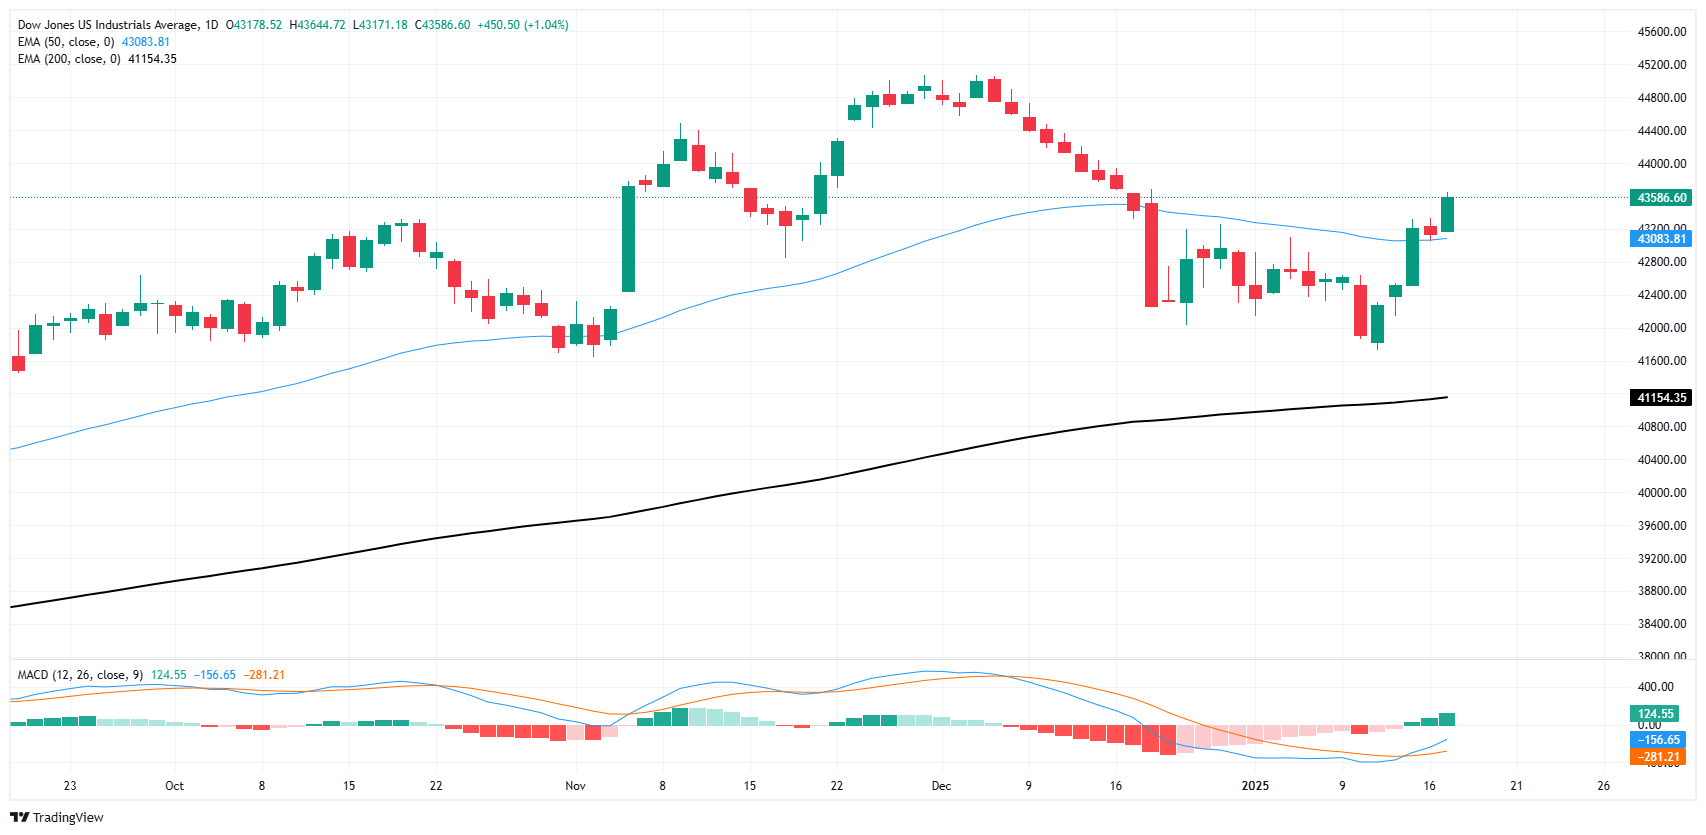
Dow Jones FAQs
The Dow Jones Industrial Average, one of the oldest stock market indices in the world, is compiled of the 30 most traded stocks in the US. The index is price-weighted rather than weighted by capitalization. It is calculated by summing the prices of the constituent stocks and dividing them by a factor, currently 0.152. The index was founded by Charles Dow, who also founded the Wall Street Journal. In later years it has been criticized for not being broadly representative enough because it only tracks 30 conglomerates, unlike broader indices such as the S&P 500.
Many different factors drive the Dow Jones Industrial Average (DJIA). The aggregate performance of the component companies revealed in quarterly company earnings reports is the main one. US and global macroeconomic data also contributes as it impacts on investor sentiment. The level of interest rates, set by the Federal Reserve (Fed), also influences the DJIA as it affects the cost of credit, on which many corporations are heavily reliant. Therefore, inflation can be a major driver as well as other metrics which impact the Fed decisions.
Dow Theory is a method for identifying the primary trend of the stock market developed by Charles Dow. A key step is to compare the direction of the Dow Jones Industrial Average (DJIA) and the Dow Jones Transportation Average (DJTA) and only follow trends where both are moving in the same direction. Volume is a confirmatory criteria. The theory uses elements of peak and trough analysis. Dow’s theory posits three trend phases: accumulation, when smart money starts buying or selling; public participation, when the wider public joins in; and distribution, when the smart money exits.
There are a number of ways to trade the DJIA. One is to use ETFs which allow investors to trade the DJIA as a single security, rather than having to buy shares in all 30 constituent companies. A leading example is the SPDR Dow Jones Industrial Average ETF (DIA). DJIA futures contracts enable traders to speculate on the future value of the index and Options provide the right, but not the obligation, to buy or sell the index at a predetermined price in the future. Mutual funds enable investors to buy a share of a diversified portfolio of DJIA stocks thus providing exposure to the overall index.
Author

Joshua Gibson
FXStreet
Joshua joins the FXStreet team as an Economics and Finance double major from Vancouver Island University with twelve years' experience as an independent trader focusing on technical analysis.

















