Dow Jones Industrial Average closes the week on a bid tone following strong US data
- Dow Jones picks up, unfazed by the strong US NFP and hawkish comments by Fed's Bowman.
- A moderate slowdown in the yearly wage growth has eased investors’ concerns about the strong employment reading.
- The sharp reversal in the weekly chart suggests that a deeper correction might be in progress.

The Dow Jones Industrial Average (DJIA) is moving higher on Friday, following upbeat US employment figures and hawkish rhetoric by Federal Reserve (Fed) Governor, Michelle Bowman. The index, however, is on track for its worst week in the last year as the strong US economic data has put the Fed's easing plans into question.
Net employment increased in March by 303K, following a 270,000 increment in February and beating expectations of about a 200K rise. Wage figures revealed that salaries keep rising although the moderation in the annual rate seems to have left hopes for a June rate cut little changed.
The market has shrugged off comments by Fed Bowman, warning about a further rate hike if inflationary trends remain high. These comments mark a verbal escalation after Minneapolis Fed President, Neel Kashkari, suggested that the bank might refrain from cutting rates this year, which sent equity markets tumbling on Thursday.
The main Wall Street indices are all positive on Friday. The NASDAQ is leading with a 1.50% advance to 16,289, followed by the S&P 500, up 1.21% at 5,207, and the Dow Jones, which adds 0.9% to 38,943.
Dow Jones news
All sectors are posting gains with Communication Services leading thanks to a 1.94% advance, followed by the Technology sector with a 1.64% gain. Tech companies are following with a 1.57% advance. The Utilities sector is the worst performer practically flat on afternoon trading.
Amazon (AMZN) is leading gains on Friday with a 3% rally to $185.39, followed by Salesforce (CRM), which advances 2.77% to $302.03. On the losing end, Intel (INTC) drops 2.27% to $38.82, still weighed down by the hefty losses reported for 2023. Next is McDonald’s (MCD) with a 0.86% decline to $267.777.
Dow Jones technical outlook
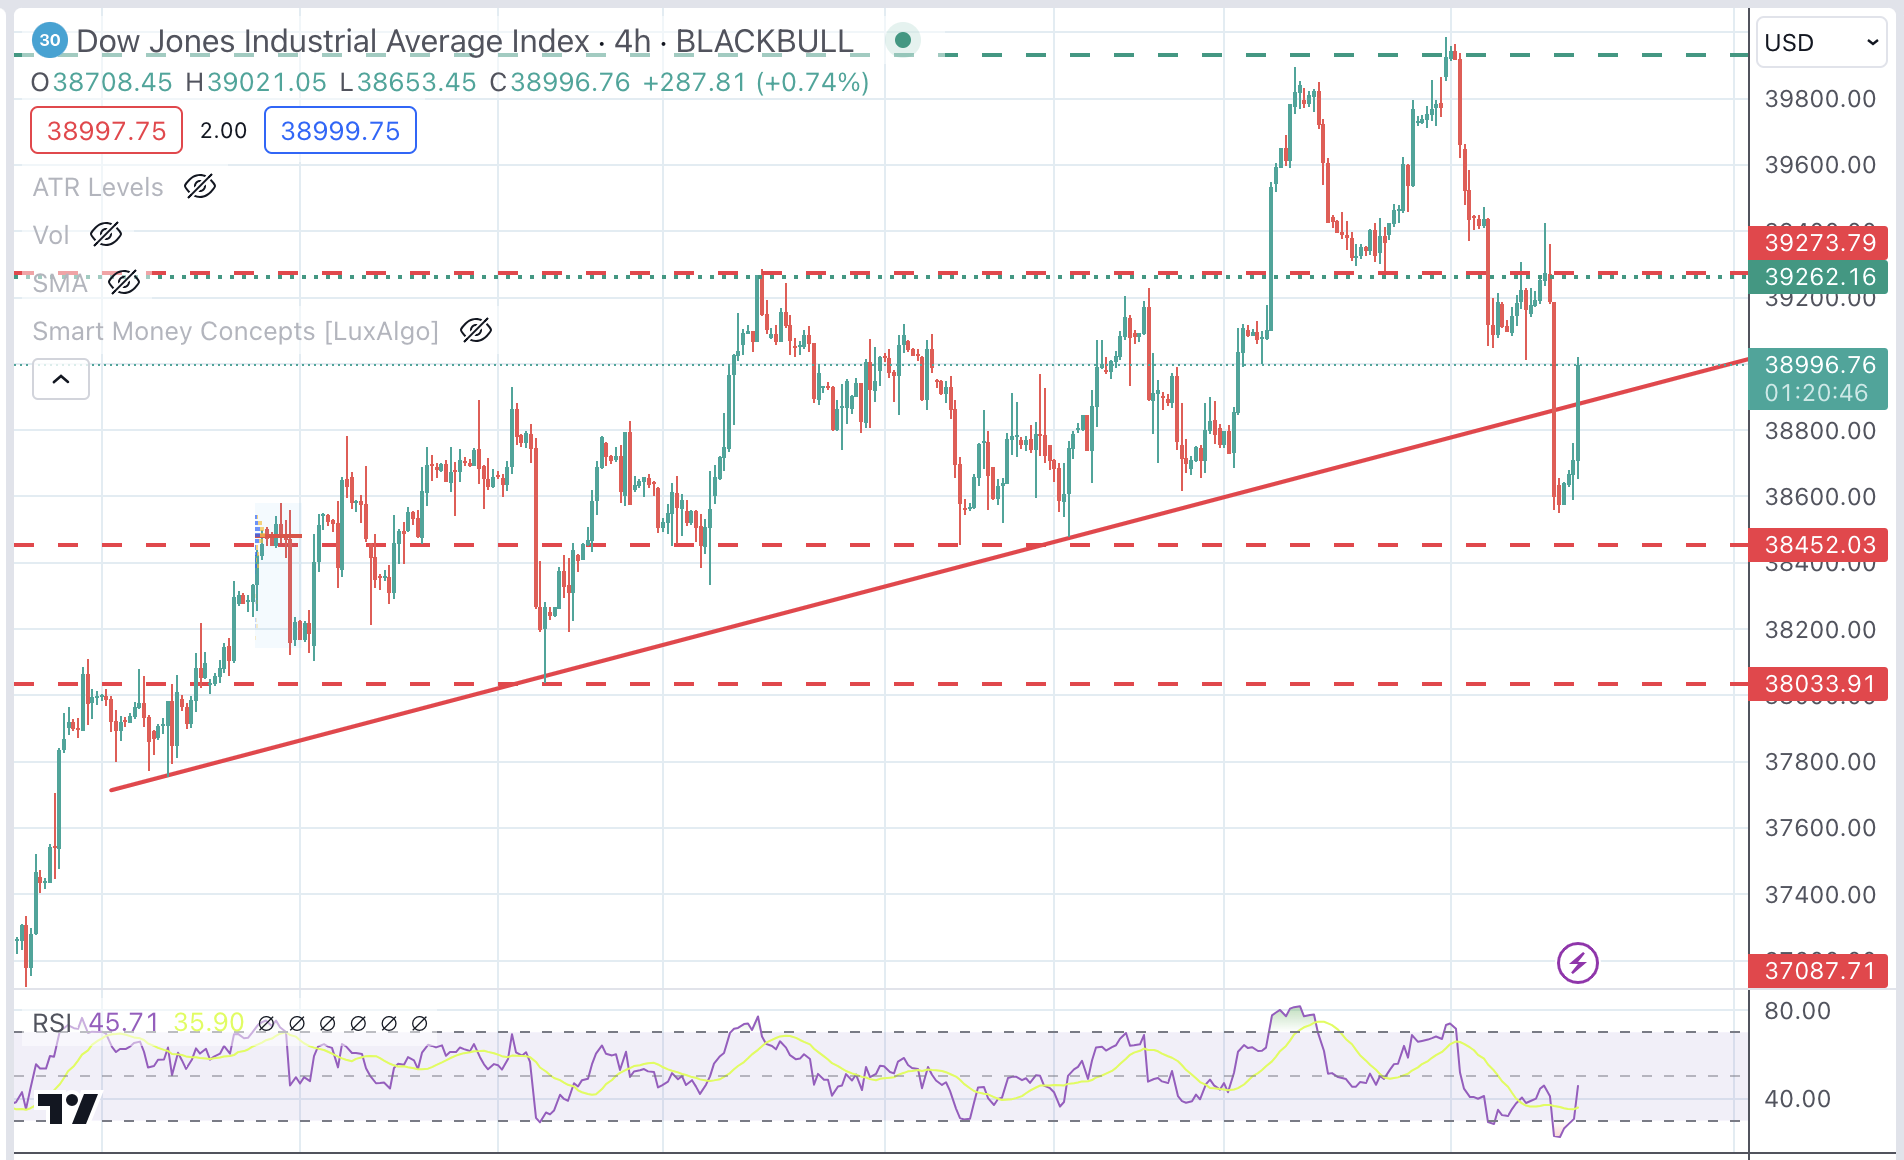
The index is trimming some losses on Friday, but the sharp reversal printed in the previous four trading days is forming a bearish engulfing candle on the weekly chart.
This formation often anticipates a major reversal. Price action has found demand above 38,500 to bounce up, but buyers might be challenged at the 39,265 resistance, which closes the path to the 40,000 top.
On the downside, a break of the 34,452 level would confirm a trend reversal and increase bearish pressure toward 38,035.
Dow Jones 4-Hour Chart
Dow Jones FAQs
The Dow Jones Industrial Average, one of the oldest stock market indices in the world, is compiled of the 30 most traded stocks in the US. The index is price-weighted rather than weighted by capitalization. It is calculated by summing the prices of the constituent stocks and dividing them by a factor, currently 0.152. The index was founded by Charles Dow, who also founded the Wall Street Journal. In later years it has been criticized for not being broadly representative enough because it only tracks 30 conglomerates, unlike broader indices such as the S&P 500.
Many different factors drive the Dow Jones Industrial Average (DJIA). The aggregate performance of the component companies revealed in quarterly company earnings reports is the main one. US and global macroeconomic data also contributes as it impacts on investor sentiment. The level of interest rates, set by the Federal Reserve (Fed), also influences the DJIA as it affects the cost of credit, on which many corporations are heavily reliant. Therefore, inflation can be a major driver as well as other metrics which impact the Fed decisions.
Dow Theory is a method for identifying the primary trend of the stock market developed by Charles Dow. A key step is to compare the direction of the Dow Jones Industrial Average (DJIA) and the Dow Jones Transportation Average (DJTA) and only follow trends where both are moving in the same direction. Volume is a confirmatory criteria. The theory uses elements of peak and trough analysis. Dow’s theory posits three trend phases: accumulation, when smart money starts buying or selling; public participation, when the wider public joins in; and distribution, when the smart money exits.
There are a number of ways to trade the DJIA. One is to use ETFs which allow investors to trade the DJIA as a single security, rather than having to buy shares in all 30 constituent companies. A leading example is the SPDR Dow Jones Industrial Average ETF (DIA). DJIA futures contracts enable traders to speculate on the future value of the index and Options provide the right, but not the obligation, to buy or sell the index at a predetermined price in the future. Mutual funds enable investors to buy a share of a diversified portfolio of DJIA stocks thus providing exposure to the overall index.
Author

Guillermo Alcala
FXStreet
Graduated in Communication Sciences at the Universidad del Pais Vasco and Universiteit van Amsterdam, Guillermo has been working as financial news editor and copywriter in diverse Forex-related firms, like FXStreet and Kantox.