Dow Jones Industrial Average nurses its Warsh hangover
- The index faded from its overnight high and drifted back toward the lower end of its daily range.
- A strong semiconductor rally did little for the Dow, which carries far less chip exposure than the technology-heavy benchmarks.
- A hawkish FOMC debut and falling Crude Oil left traders with mixed signals ahead of the Juneteenth holiday.

Wall Street's blue-chip index spent Thursday picking up the pieces of Wednesday's hawkish Federal Reserve (Fed) selloff, and not even a roaring chip trade could coax it back into the green. The Dow Jones Industrial Average (DJIA) had two reasons to rally on paper, a screaming semiconductor tape and a sharp drop in Crude Oil, and it brushed off both.
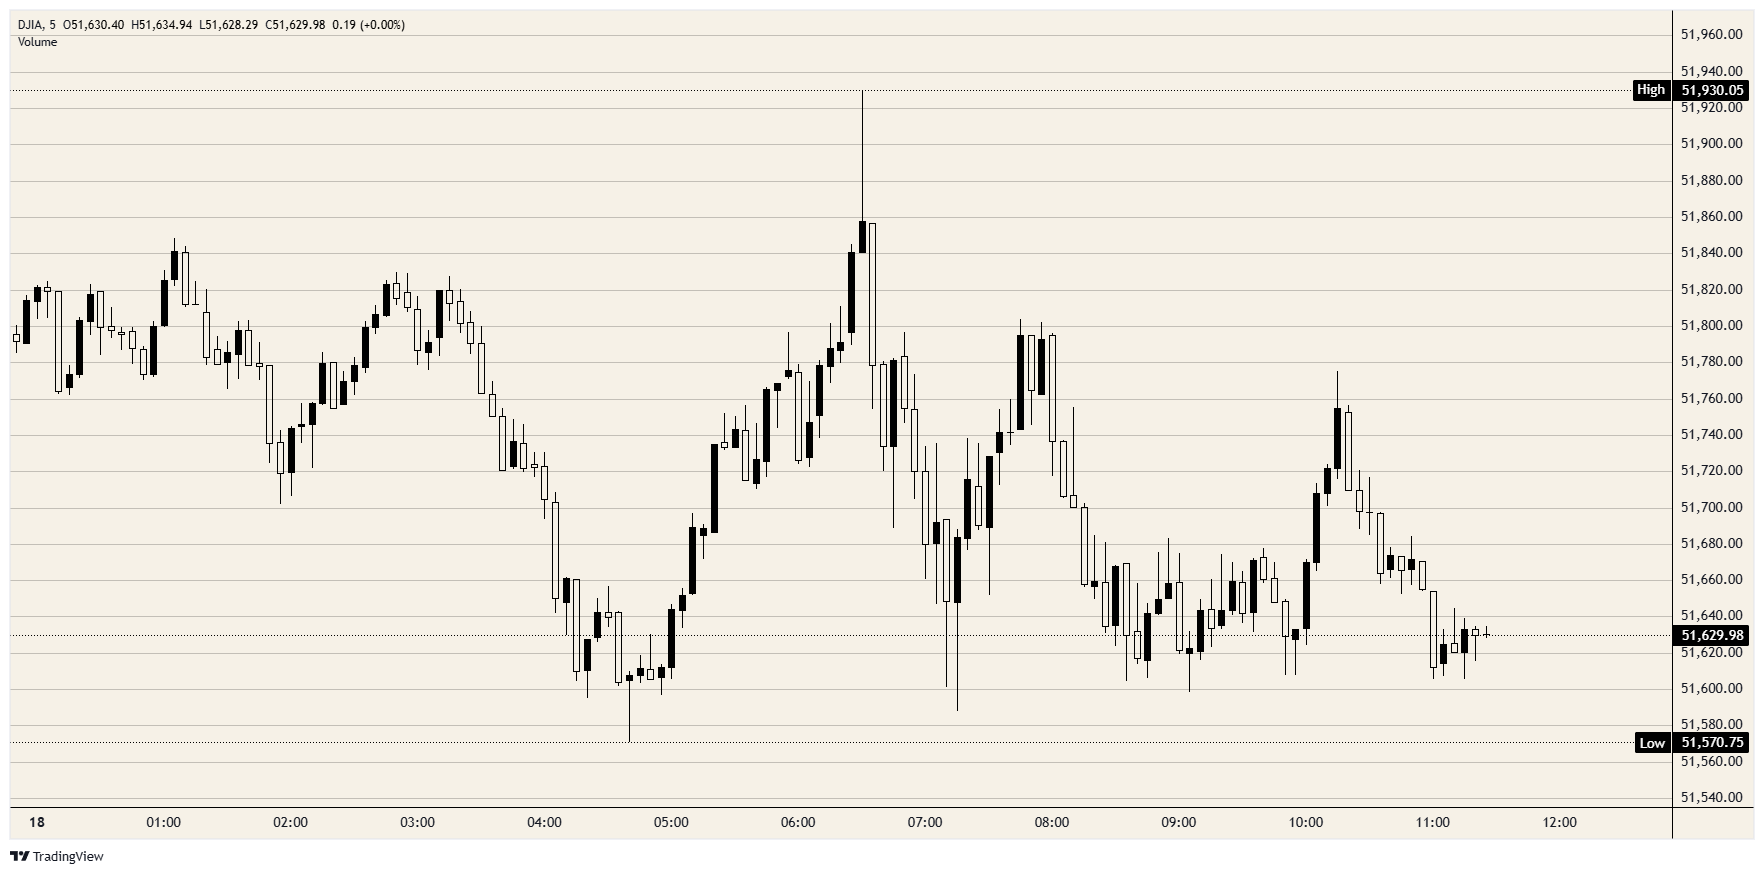
The index spiked toward 51,900 in overnight trade, ran into heavy selling, and slid back to hover close to 51,600, leaving it stuck in the lower third of its daily range while the chip names sprinted. The striking part of the session is that two genuine tailwinds showed up and the average still could not hold a bid.
A chip rally the Dow was never built to catch
The day's marquee trade lived in semiconductors. Intel jumped around 10% after the White House flagged a chip-design partnership with Apple, Micron climbed roughly 6%, Nvidia added more than 1%, and a benchmark semiconductor fund rose better than 5%.
None of that does much for an old-economy, price-weighted average. The Dow holds Apple and Nvidia but not Intel, which was dropped from the average in late 2024, so the single biggest mover of the day never touched it; the blue chips were always going to watch this rally from the sidelines.
Cheaper Crude Oil, and a Fed that isn't impressed
The other supposed tailwind came from energy. West Texas Intermediate (WTI) Crude Oil fell around 3% toward $74 and Brent slid nearly as much near $77 after the Vice President said tankers carrying more than 12 million barrels had cleared the Strait of Hormuz, following Wednesday's memorandum of understanding between Washington and Tehran. Some desks framed the move as Crude Oil doing the Fed's work, pulling inflation lower and easing the pressure on policymakers.
That tidy story leans on two assumptions the market cannot yet verify. It assumes the de-escalation holds well past the initial 60-day window, and it assumes the inflation problem is mostly an energy story when services and wages are doing the heavy lifting; the committee, for its part, just signaled it is in no mood to take the win.
Warsh keeps his cards close
Wednesday's Federal Open Market Committee (FOMC) meeting, Warsh's first as chair, is what the tape is still digesting. The updated dot plot showed nine of 18 officials now expecting higher rates in 2026, a hawkish lurch, while Warsh declined to submit a forecast of his own and leaned hard on the language of price stability.
A new chair who will not show his own dot, presiding over a committee split down the middle on whether the next move is a hike, is exactly the kind of communication vacuum equity markets punish. The blue chips capture none of the upside from the idiosyncratic chip trade while still carrying the weight of a hawkish Fed, which is much of why the average cannot rally with the tailwinds lined up in front of it.
Resistance: Near-term supply sits around 51,800, the level that capped every bounce through the session. Above it, the rejected overnight spike near 51,900 is the bigger barrier, with the 52,000 handle behind it.
Support: The 51,600 area is the immediate floor and has been defended repeatedly. A clean break opens the session low near 51,550, with the 51,500 handle beneath it.
Bias: Modestly lower while the index holds below the 51,800 area. A hawkish Fed, a chip rally the blue chips cannot share, and thin holiday liquidity all argue for more drift than recovery, and a daily close back above 51,800 is the minimum the bulls need to flip that read. The next real verdicts come next week, with flash Purchasing Managers Index (PMI) prints on Tuesday and the Core Personal Consumption Expenditures (PCE) Price Index on Thursday, the very release those hawkish dots are built around.
Dow Jones 5-minute chart
Dow Jones FAQs
The Dow Jones Industrial Average, one of the oldest stock market indices in the world, is compiled of the 30 most traded stocks in the US. The index is price-weighted rather than weighted by capitalization. It is calculated by summing the prices of the constituent stocks and dividing them by a factor, currently 0.152. The index was founded by Charles Dow, who also founded the Wall Street Journal. In later years it has been criticized for not being broadly representative enough because it only tracks 30 conglomerates, unlike broader indices such as the S&P 500.
Many different factors drive the Dow Jones Industrial Average (DJIA). The aggregate performance of the component companies revealed in quarterly company earnings reports is the main one. US and global macroeconomic data also contributes as it impacts on investor sentiment. The level of interest rates, set by the Federal Reserve (Fed), also influences the DJIA as it affects the cost of credit, on which many corporations are heavily reliant. Therefore, inflation can be a major driver as well as other metrics which impact the Fed decisions.
Dow Theory is a method for identifying the primary trend of the stock market developed by Charles Dow. A key step is to compare the direction of the Dow Jones Industrial Average (DJIA) and the Dow Jones Transportation Average (DJTA) and only follow trends where both are moving in the same direction. Volume is a confirmatory criteria. The theory uses elements of peak and trough analysis. Dow’s theory posits three trend phases: accumulation, when smart money starts buying or selling; public participation, when the wider public joins in; and distribution, when the smart money exits.
There are a number of ways to trade the DJIA. One is to use ETFs which allow investors to trade the DJIA as a single security, rather than having to buy shares in all 30 constituent companies. A leading example is the SPDR Dow Jones Industrial Average ETF (DIA). DJIA futures contracts enable traders to speculate on the future value of the index and Options provide the right, but not the obligation, to buy or sell the index at a predetermined price in the future. Mutual funds enable investors to buy a share of a diversified portfolio of DJIA stocks thus providing exposure to the overall index.
Author

Joshua Gibson
FXStreet
Joshua joins the FXStreet team as an Economics and Finance double major from Vancouver Island University with twelve years' experience as an independent trader focusing on technical analysis.