Dow Jones Industrial Average futures slide as CPI hits 3.8%, China trip looms
- Headline CPI ran at 3.8% YoY in April, the hottest annual print since May 2023 and above the 3.7% consensus.
- Core CPI also overshot, ticking up to 2.8% YoY and 0.4% MoM, hinting at broadening price pressure beyond gasoline.
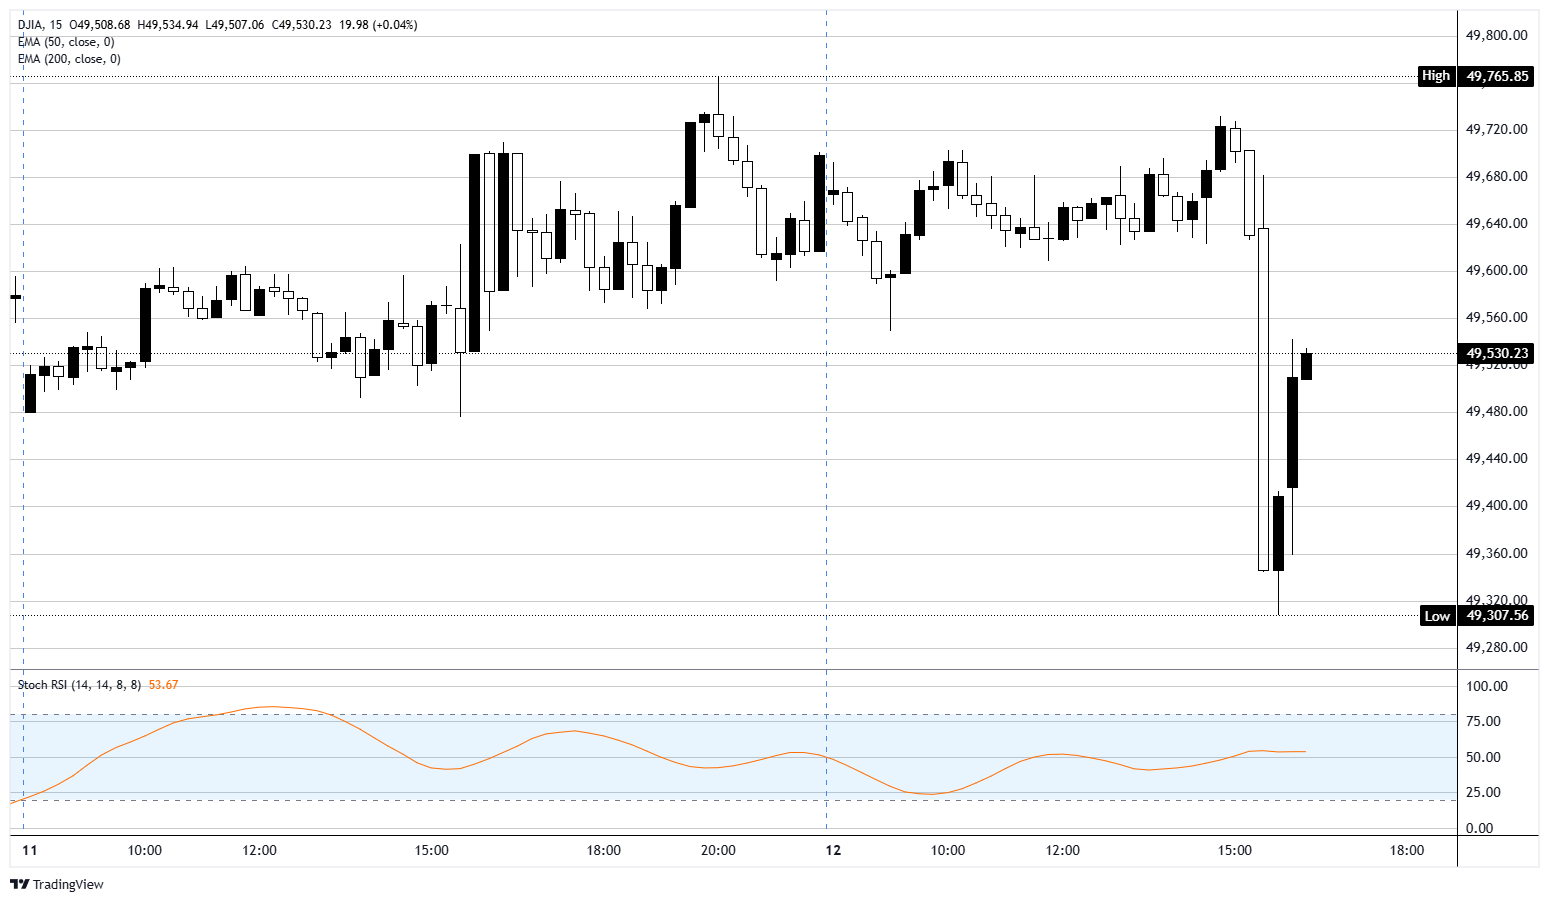
- DJIA futures slid from near 49,800 to below 49,400 in the minutes after the release before stabilizing above 49,500.
- Markets now price close to zero Fed rate cuts in 2026, with the first move pushed deep into 2027 territory.

Overnight and premarket
Dow Jones Industrial Average (DJIA) futures spent the overnight session in a tight range between 49,600 and 49,700, with little appetite to pick a side ahead of the April Consumer Price Index (CPI). That calm broke at 12:30 GMT, when the report landed hotter than expected and sent futures roughly 400 points lower inside a single 15-minute candle. The contract has since clawed back about half the move, trading back above 49,500, but the rate cut narrative that drove the first quarter just took another body blow.
Sticky inflation, stickier core
Headline CPI rose 0.6% MoM in April, matching consensus, while the YoY figure jumped to 3.8% from 3.3% in March, the hottest reading since May 2023. The Bureau of Labor Statistics (BLS) attributed more than 40% of the monthly gain to the energy index, which itself jumped 3.8% MoM. Gasoline is now running close to 30% above year-ago levels, a direct readout of the Iran war's grip on Oil supply and the Strait of Hormuz disruption. Core CPI, which strips out food and energy, rose 0.4% MoM and 2.8% YoY, both above forecast. That last line is the one that matters: the energy shock is bleeding into broader goods and services pricing rather than staying contained at the pump.
Rate cut hopes wiped from the board
Heading into the print, traders had already pared their easing bets. The data finished the job. CME Group's FedWatch tool now shows near-zero probability of a Federal Reserve (Fed) cut anywhere in 2026, with the first move drifting into the back half of 2027 per Bank of America and other major sell-side calls. Fed's Goolsbee, due at 13:00 GMT, is flagged hawkish on the economic calendar, which would only reinforce the message. The Federal Open Market Committee (FOMC) has little room to cut while gasoline runs at 28% YoY and core inflation is reaccelerating, even with growth signals softening at the edges.
Pipeline pressure on Wednesday and Thursday
The Producer Price Index (PPI) lands on Wednesday at 12:30 GMT, with the YoY headline number expected to jump to 4.9% from 4% and core PPI seen at 4.3% from 3.8%. Hot PPI on top of hot CPI would extend the disinflation setback into pipeline territory and leave the Fed even less cover to cut. Thursday brings April Retail Sales, where consensus sits at 0.5% MoM versus 1.7% previously. Worth flagging: retail sales are reported in nominal terms, not adjusted for inflation. With headline CPI printing 0.6% MoM, a 0.5% nominal retail sales figure actually means real consumer spending contracted in April. Expect plenty of "consumer holding up" headlines that quietly evaporate once deflated by the CPI itself.
Trump heads to Beijing with low expectations
Adding to the macro overhang, Trump arrives in Beijing on Wednesday evening for a state visit with Xi Jinping, with formal meetings on Thursday and Friday. Iran is firmly on the agenda. With the Strait of Hormuz still snarled and the ceasefire widely described as cracking, the administration is reportedly looking to lean on China over its purchases of Iranian Oil. Expect the usual pageantry, a soybean order, possibly a Boeing deal, and polite restatements of existing positions. Markets are not pricing in much from the trip, and that probably reflects reality. China remains Iran's largest Oil customer and has refused to recognize US sanctions on Iranian crude, so the optimistic case for a meaningful pressure win is thin. For DJIA bulls hoping the visit delivers a circuit-breaker on the Iran story, the bar is set low for a reason.
Dow Jones 15-minute chart
Futures FAQs
The futures market is an exchange-based auction in which participants buy and sell contracts of an underlying asset at a predetermined future date and price. The set price is agreed upon today and is derived from the underlying asset. Futures contracts can be based on a wide range of assets, with commodities among the most popular, although currencies and indices are other common underlying assets. Futures prices depend on their underlying asset and act as a mechanism for firms, institutions, and large-position traders to manage risks through hedging.
Futures can be traded in different ways. The most common ways are via a regulated exchange or via Contracts For Difference (CFDs). In the former, liquidity is high and pricing is more transparent, with the broker serving only as an intermediary between you and the market. Still, it generally requires more capital. The largest futures exchanges are the Chicago Mercantile Exchange (CME) and the New York Mercantile Exchange (NYME). As for CFDs, these require less capital and thus trading is more flexible, but at the cost of less transparency.
The E-mini S&P 500 index, Crude Oil (Brent, WTI), Natural Gas, Gold, Silver, Copper, and soft commodities such as grains are among the most actively traded contracts. These offer strong liquidity and are closely followed by traders worldwide. Futures market volume consistently exceeds spot market volume, often significantly. This dominance is driven by leverage, hedging, and higher liquidity on exchanges.
Yes. Future gauges, particularly equity index futures such as those of the S&P 500 or the Nasdaq, are widely considered key gauges of market sentiment because they reflect investors’ expectations for the next session’s opening price. When equity futures drop, it is a sign of risk-aversion, signaling bearish market sentiment. On the contrary, rising equity futures suggest markets are risk on.
As a futures contract approaches its maturity date, the futures price converges upon the spot price, becoming almost identical at expiration. However, prices can diverge significantly before the contract ends. A market is in contango when future prices are higher than spot prices, while the mirror image is called backwardation (when current prices are higher than future prices). For commodities, the normal state of the market is contango because holding the asset over time incurs costs such as storage or insurance fees. When markets turn from contango to backwardation – or vice versa – it signals a shift in the trend: a change from contango to backwardation is taken as a bullish sign, while going from backwardation to contango is generally considered bearish.
Author

Joshua Gibson
FXStreet
Joshua joins the FXStreet team as an Economics and Finance double major from Vancouver Island University with twelve years' experience as an independent trader focusing on technical analysis.

















