Dow Jones Industrial Average futures flat, Oil surges 5% on Iran escalation
- Dow Jones Industrial Average futures finished Monday virtually unchanged from Friday's close despite a weekend of sharply escalating US-Iran tensions.
- President Trump confirmed the US had fired on and seized an Iranian-flagged cargo ship in the Gulf of Oman, while Iran walked away from US-brokered peace talks in Pakistan.
- West Texas Intermediate crude jumped 5% above $88 per barrel as Strait of Hormuz shipping traffic remained restricted and the ceasefire neared expiry.
- Oil, not equities, did the work of pricing weekend developments, with the blue-chip index holding its ground even as the list of near-term risks lengthened.

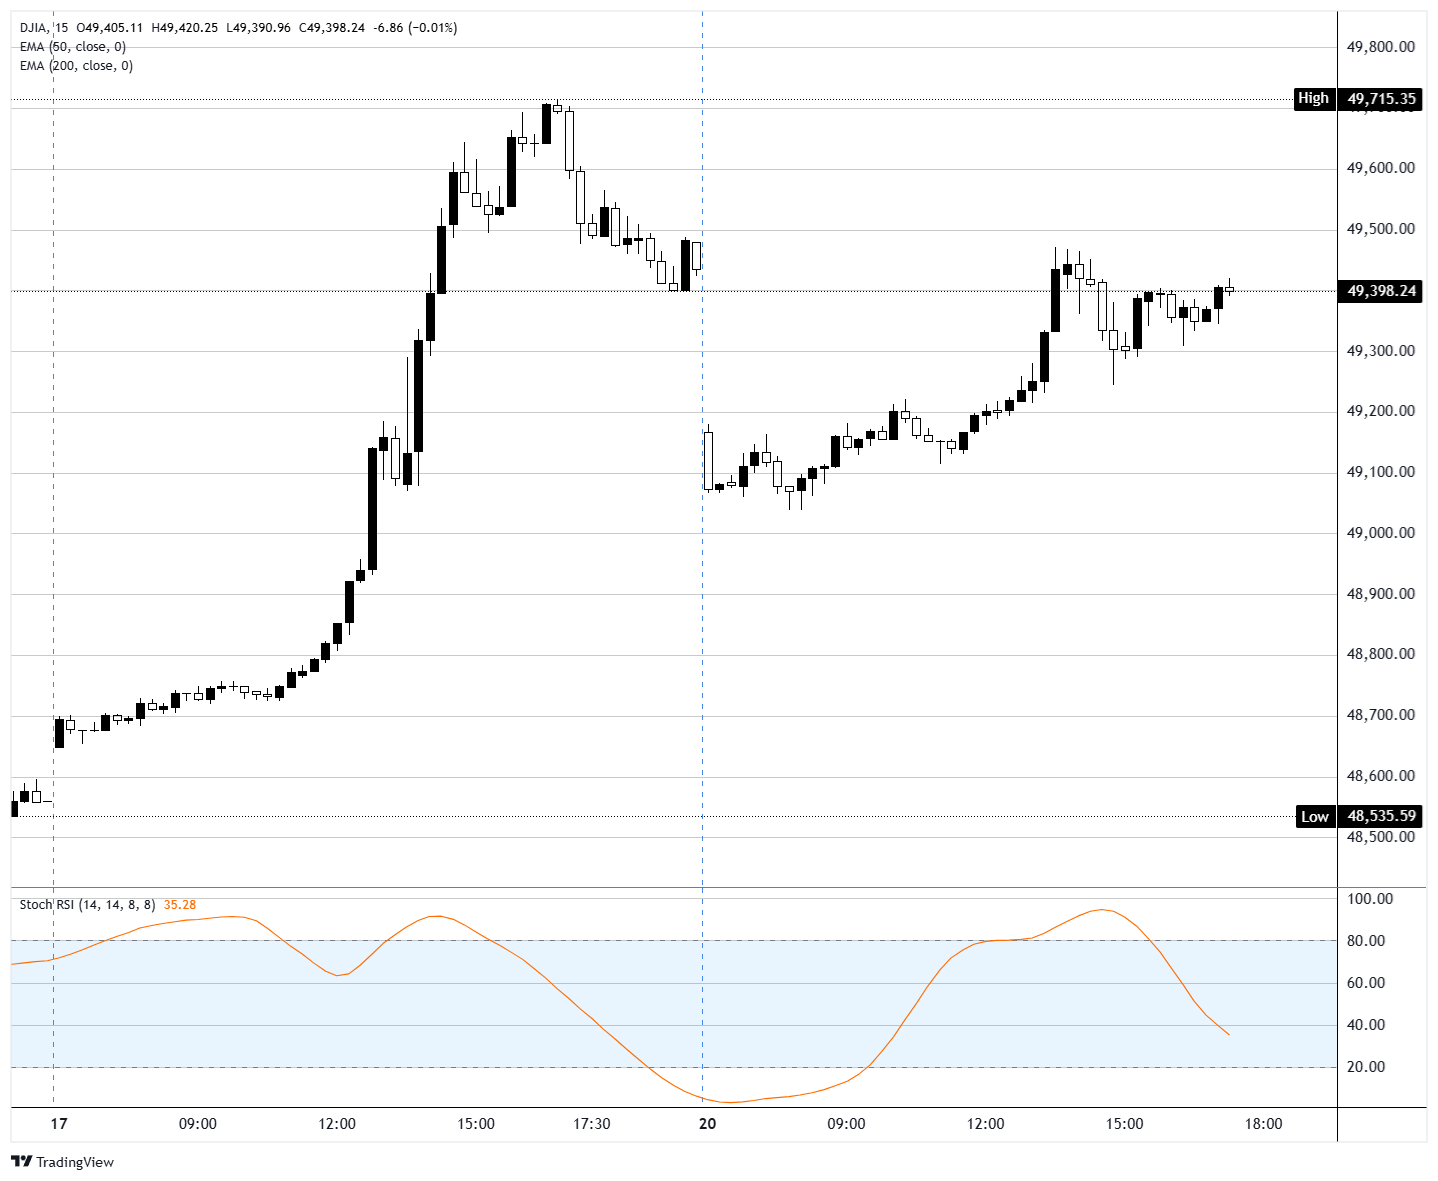
Dow Jones Industrial Average (DJIA) futures gapped lower at Sunday's reopen toward the 49,100 area but ground steadily higher through the US session to settle only marginally below Friday's closing handle near 49,400. The benchmark ended effectively flat on the day, with the S&P 500 down 0.4% and the Nasdaq Composite off 0.5%. Given the scale of weekend developments, a boarded tanker in the Gulf of Oman, collapsed peace talks, and a ceasefire expiring this week, the refusal to discount any meaningful risk premium stood out.
A weekend of deterioration, barely a flinch
The backdrop worsened on several fronts at once. Trump on Sunday said the US had fired on and seized an Iranian-flagged cargo vessel in the Gulf of Oman, citing prior US Treasury sanctions for "illegal activity" as grounds. Iran then declined another round of US-brokered talks in Pakistan, and Trump threatened to destroy Iranian power plants and bridges if Tehran does not come to terms before the current ceasefire lapses later this week. Yet DJIA futures opened roughly three-quarters of a percent lower and spent the session retracing almost all of that gap, closing about where they started Friday. For an index that fell hard just weeks ago on thinner provocations, the stability was hard to pin on geopolitics alone.
Oil does the pricing work
If equities would not move, Oil did. WTI popped 5% above $88 per barrel, with Brent up a similar amount above $94. The bid followed confirmation that vessel traffic through the Strait of Hormuz was restricted again by Saturday, with Iranian state media arguing the US "did not fulfill their obligations" after Iran had briefly declared the chokepoint reopened following the Iran-Lebanon ceasefire. Trump has reiterated that the US naval blockade of the strait will remain in place until Iran accepts Washington's terms. Crude traders, exposed directly to physical supply risk, moved first and moved hard.
The "rearview mirror" call keeps holding
"The war with Iran is now in the rearview mirror for the market," David Wagner, head of equities and portfolio manager at Aptus Capital Advisors, told CNBC. The confidence is striking given the news mix. Wall Street is coming off a week in which the S&P 500 gained 4.5% and the Nasdaq Composite popped around 7%, with the Nasdaq notching its 13th consecutive winning session on Friday, matching a streak last seen in 1992. Traders who bought every dip through recent weeks have been rewarded, and that conditioning was on full display again on Monday.
Software leads, defensive bid absent
Inside the tape, software was the standout factor on the long side, with the iShares Expanded Tech-Software Sector ETF (IGV) last up 0.6%. What was conspicuously missing was any meaningful rotation into defensives on a day featuring a seized foreign vessel, a cancelled round of peace talks, and a Presidential threat to strike national infrastructure. With no tier-one US economic data on today's docket, direction into Tuesday will likely be dictated by incremental US-Iran headlines, any shift in the ceasefire posture, and whether Oil holds above the $88 handle into the overnight session.
Dow Jones 15-minute chart
Dow Jones FAQs
The Dow Jones Industrial Average, one of the oldest stock market indices in the world, is compiled of the 30 most traded stocks in the US. The index is price-weighted rather than weighted by capitalization. It is calculated by summing the prices of the constituent stocks and dividing them by a factor, currently 0.152. The index was founded by Charles Dow, who also founded the Wall Street Journal. In later years it has been criticized for not being broadly representative enough because it only tracks 30 conglomerates, unlike broader indices such as the S&P 500.
Many different factors drive the Dow Jones Industrial Average (DJIA). The aggregate performance of the component companies revealed in quarterly company earnings reports is the main one. US and global macroeconomic data also contributes as it impacts on investor sentiment. The level of interest rates, set by the Federal Reserve (Fed), also influences the DJIA as it affects the cost of credit, on which many corporations are heavily reliant. Therefore, inflation can be a major driver as well as other metrics which impact the Fed decisions.
Dow Theory is a method for identifying the primary trend of the stock market developed by Charles Dow. A key step is to compare the direction of the Dow Jones Industrial Average (DJIA) and the Dow Jones Transportation Average (DJTA) and only follow trends where both are moving in the same direction. Volume is a confirmatory criteria. The theory uses elements of peak and trough analysis. Dow’s theory posits three trend phases: accumulation, when smart money starts buying or selling; public participation, when the wider public joins in; and distribution, when the smart money exits.
There are a number of ways to trade the DJIA. One is to use ETFs which allow investors to trade the DJIA as a single security, rather than having to buy shares in all 30 constituent companies. A leading example is the SPDR Dow Jones Industrial Average ETF (DIA). DJIA futures contracts enable traders to speculate on the future value of the index and Options provide the right, but not the obligation, to buy or sell the index at a predetermined price in the future. Mutual funds enable investors to buy a share of a diversified portfolio of DJIA stocks thus providing exposure to the overall index.
Author

Joshua Gibson
FXStreet
Joshua joins the FXStreet team as an Economics and Finance double major from Vancouver Island University with twelve years' experience as an independent trader focusing on technical analysis.
















