Dow Jones Industrial Average drops again as Iran war bogs down equity markets
- US equity indices fell to fresh 2026 lows as escalating Middle East strikes on energy infrastructure sent Brent crude past $118 a barrel.
- The Federal Reserve held rates steady on Wednesday, with seven FOMC members projecting no cuts this year and markets now pricing less than a 60% chance of easing by December.
- Weekly jobless claims unexpectedly fell to 205K while the Philadelphia Fed manufacturing index surged to a five-month high.

The Dow Jones Industrial Average (DJIA) extended losses on Thursday, falling below 46,000 as a renewed spike in Crude Oil prices deepened concerns about stagflation in the US economy. The S&P 500 dropped around 0.8%, slipping below its 200-day moving average for the first time since May, while the Nasdaq Composite fell roughly 1%. Selling pressure was broad-based, with the Russell 2000 flirting with correction territory after declining nearly 10% from its 52-week high.
Oil rout accelerates on Middle East strikes
Brent Crude Oil futures surged past $118 a barrel early Thursday before paring gains to trade near $112, after Iranian strikes hit a key liquefied natural gas export facility in Qatar and Saudi energy infrastructure overnight. West Texas Intermediate crude climbed toward $97. The spike marks the latest escalation in the nearly three-week-old conflict between the US, Israel, and Iran, which has effectively shut down tanker traffic through the Strait of Hormuz and removed roughly 20 million barrels per day of exports from the market. European natural gas prices jumped as much as 35%. US Defense Secretary Pete Hegseth said Thursday the Pentagon would seek up to $200 billion in supplemental war funding, warning that the US would launch its "largest strike package yet" against Iran. Why the US requires a weekly cycle of "largest ever" strikes against an opponent they are also claiming to be "completely dominating" has not yet been explained.
Fed holds rates, rate cut expectations evaporate
The Federal Reserve (Fed) held its benchmark rate in the 3.50%-3.75% range on Wednesday in an 11-1 vote, as widely expected. But the messaging was notably hawkish. The updated dot plot still projected one 25 basis-point cut in 2026, though seven Federal Open Market Committee (FOMC) members now see no cuts this year at all. The committee raised its core Personal Consumption Expenditures Price Index (PCE) inflation forecast for 2026 from 2.5% to 2.7%, citing tariff-driven goods inflation and geopolitical energy risks. Fed Chair Jerome Powell acknowledged that the oil shock would push up inflation and weigh on growth, but rejected the term stagflation and described growth as "solid." CME FedWatch data now shows less than a 60% probability of even a single rate cut by December, sharply down from earlier in the week when markets had been pricing four to five potential meetings for a first cut.
Micron delivers record quarter, but capex guidance spooks investors
Micron (MU) fell around 7% on Thursday despite posting record quarterly results that crushed estimates. The chipmaker reported earnings per share of $12.20, well above the $8.73 consensus, on revenue of $23.86 billion — a 196% year-over-year increase driven by soaring demand for high-bandwidth memory used in Nvidia (NVDA) AI accelerators. However, the company raised its fiscal 2026 capital expenditure guidance by $5 billion to fund domestic manufacturing under the CHIPS Act, and guided third-quarter revenue to $33.5 billion. Investors focused on the capex overshoot rather than the blowout topline. Nvidia fell over 2% in sympathy, while Broadcom (AVGO) also declined.
Economic data paints a mixed picture
Weekly Initial Jobless Claims fell 8K to a seasonally adjusted 205K for the week ended March 14, beating the 215K consensus and hitting the lowest level since January. The data reinforces the pattern of low layoffs coexisting with subdued hiring, and covers the survey period for March's Nonfarm Payrolls report. Continuing claims ticked up 10K to 1.857 million. Separately, the Philadelphia Fed manufacturing index jumped to 18.1 in March from 16.3, blowing past expectations of 8.3 and marking a five-month high. Current shipments surged to their highest level since January 2025, though both prices paid and prices received accelerated — a reminder that inflationary pressures in goods production remain firmly in play.
Boeing and industrials weigh on the Dow
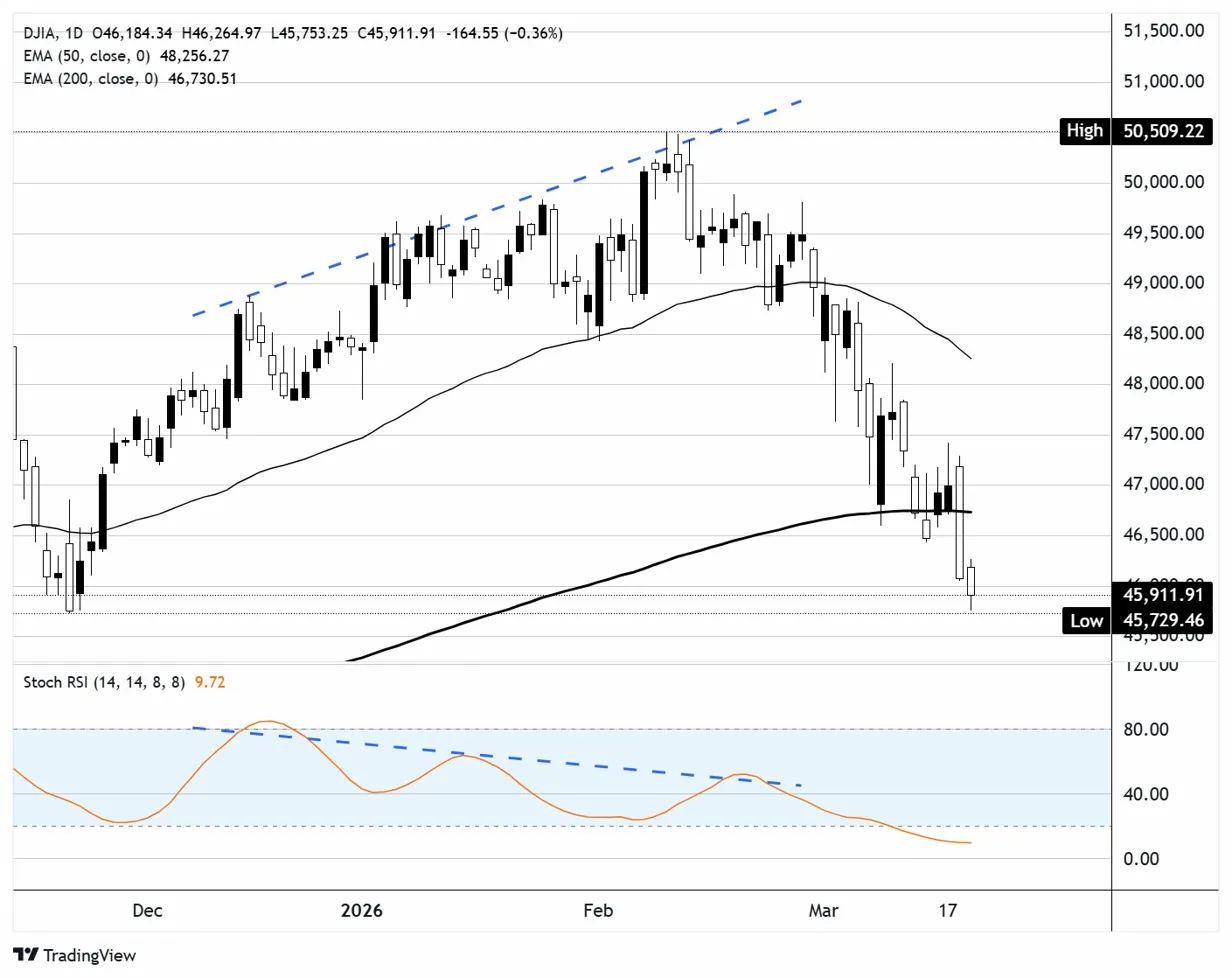
Boeing (BA) was the heaviest drag on the Dow, falling over 3% as the broader industrial sector came under pressure from rising input costs and supply chain uncertainty tied to the conflict. Caterpillar (CAT) dropped over 2%, and Sherwin-Williams (SHW) fell around 2%. On the upside, Salesforce (CRM) gained over 1.5% to lead Dow advancers, while Verizon (VZ) and Walt Disney (DIS) also posted modest gains. The DJIA is now trading well below its 200-day exponential moving average near 46,700 and roughly 9% off its all-time high above 50,500. The Stochastic RSI has fallen to deeply oversold levels near 10, the lowest reading in months — though oversold conditions alone are unlikely to trigger a reversal while oil prices remain untethered and rate cut expectations continue to erode.
Dow Jones daily chart
Dow Jones FAQs
The Dow Jones Industrial Average, one of the oldest stock market indices in the world, is compiled of the 30 most traded stocks in the US. The index is price-weighted rather than weighted by capitalization. It is calculated by summing the prices of the constituent stocks and dividing them by a factor, currently 0.152. The index was founded by Charles Dow, who also founded the Wall Street Journal. In later years it has been criticized for not being broadly representative enough because it only tracks 30 conglomerates, unlike broader indices such as the S&P 500.
Many different factors drive the Dow Jones Industrial Average (DJIA). The aggregate performance of the component companies revealed in quarterly company earnings reports is the main one. US and global macroeconomic data also contributes as it impacts on investor sentiment. The level of interest rates, set by the Federal Reserve (Fed), also influences the DJIA as it affects the cost of credit, on which many corporations are heavily reliant. Therefore, inflation can be a major driver as well as other metrics which impact the Fed decisions.
Dow Theory is a method for identifying the primary trend of the stock market developed by Charles Dow. A key step is to compare the direction of the Dow Jones Industrial Average (DJIA) and the Dow Jones Transportation Average (DJTA) and only follow trends where both are moving in the same direction. Volume is a confirmatory criteria. The theory uses elements of peak and trough analysis. Dow’s theory posits three trend phases: accumulation, when smart money starts buying or selling; public participation, when the wider public joins in; and distribution, when the smart money exits.
There are a number of ways to trade the DJIA. One is to use ETFs which allow investors to trade the DJIA as a single security, rather than having to buy shares in all 30 constituent companies. A leading example is the SPDR Dow Jones Industrial Average ETF (DIA). DJIA futures contracts enable traders to speculate on the future value of the index and Options provide the right, but not the obligation, to buy or sell the index at a predetermined price in the future. Mutual funds enable investors to buy a share of a diversified portfolio of DJIA stocks thus providing exposure to the overall index.
Author

Joshua Gibson
FXStreet
Joshua joins the FXStreet team as an Economics and Finance double major from Vancouver Island University with twelve years' experience as an independent trader focusing on technical analysis.


