|

DAX outlook: Five‑swing Elliott Wave structure from August 28 high projects 24,350 [Video]

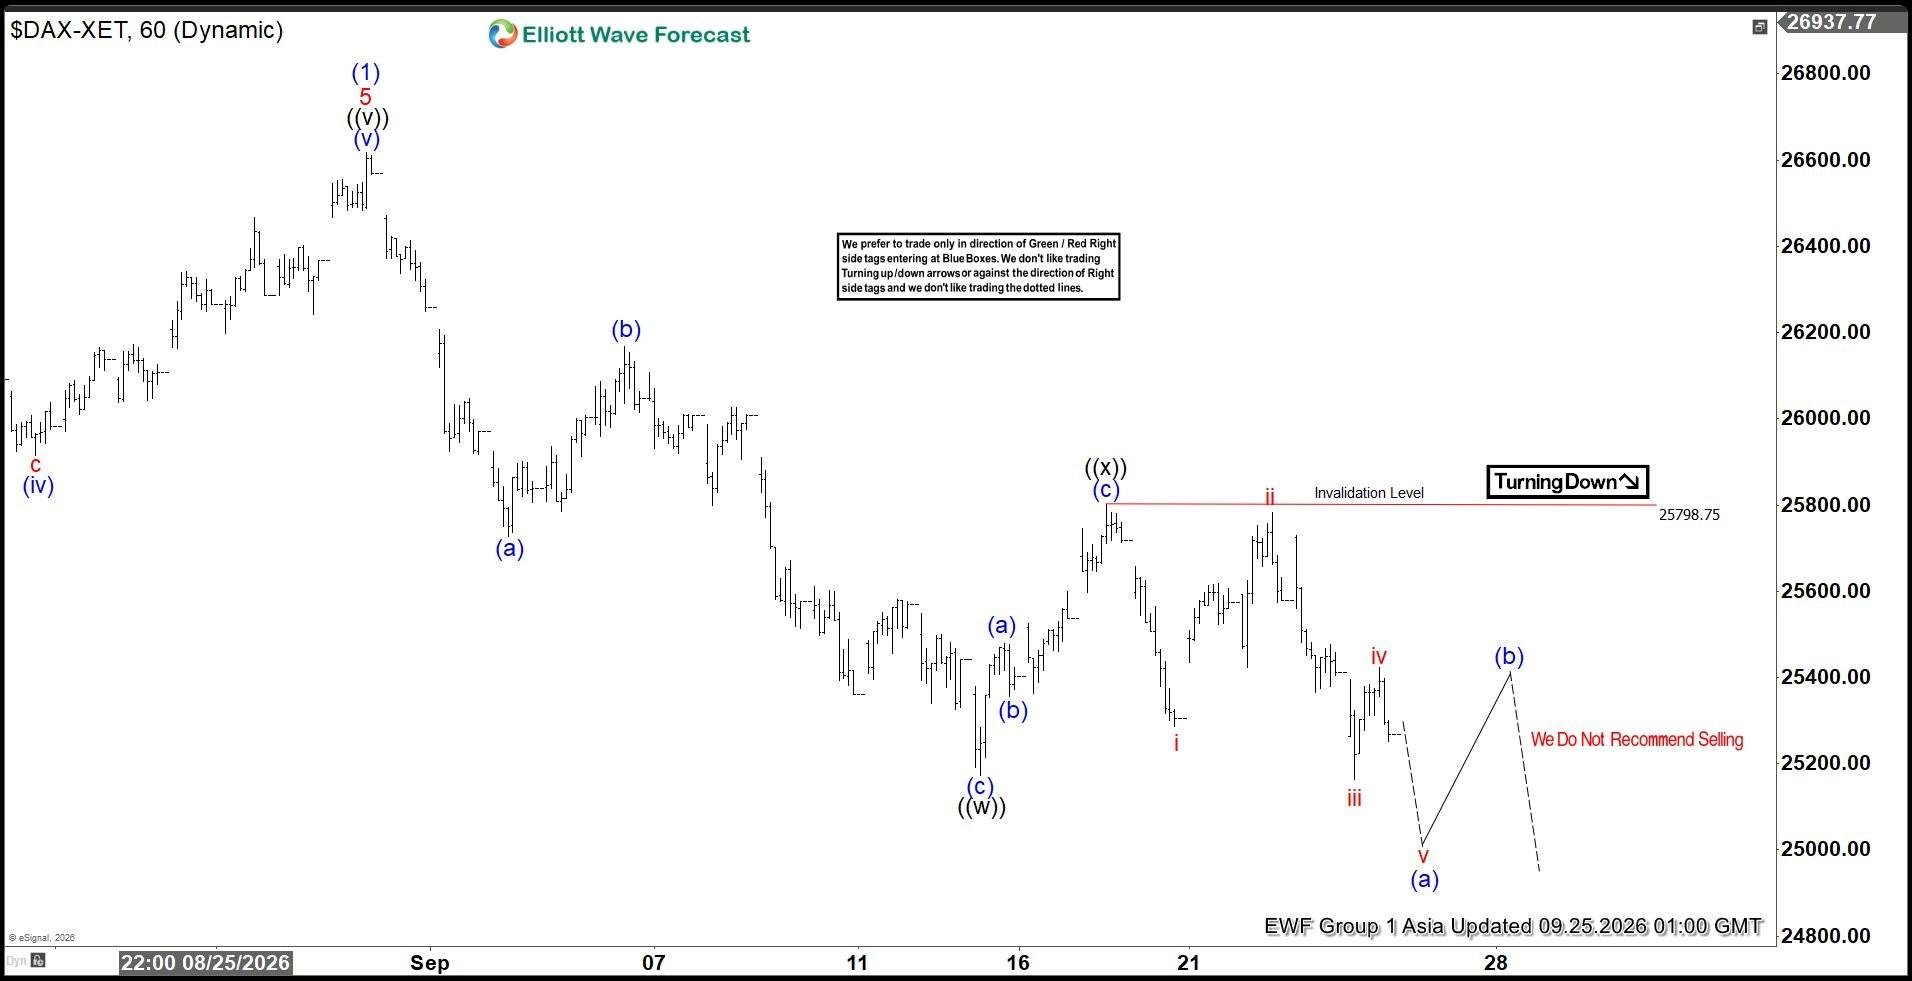
The short‑term Elliott Wave view in DAX shows that the decline from the August 28, 2026 high is unfolding as a five‑swing corrective sequence. A five‑swing sequence is a motive structure that favors continuation lower. The decline is proposed to be taking the form of a double three Elliott Wave structure.

From the August 28 high, wave (a) ended at 25,727.93. A rally in wave (b) terminated at 26,167.93. The subsequent move lower in wave (c) ended at 25,172.89, completing wave ((w)). A corrective rally in wave ((x)) then finished at 25,798.75. Afterward, the Index resumed its decline in wave ((y)), breaking below the prior wave ((w)) low. This resumption confirms the bearish sequence and strengthens the case for further downside.

The target for wave ((y)) can be projected using the 100%–161.8% Fibonacci extension of wave ((w)). This calculation yields a target zone between 23,460 and 24,350. In the short term, the Index is expected to complete a diagonal wave (a). It should then rally in wave (b) to retrace the cycle from the September 17, 2026 high. That rally is likely to unfold in either three or seven swings before the decline resumes in wave (c).

Near term, as long as the pivot at 25,798.75 remains intact, the Elliott Wave structure favors continuation lower toward the 24,350 area. This level represents a key inflection zone where the correction may stabilize before reassessing the broader cycle.

DAX 60-minute Elliott Wave chart
DAX

DAX Elliott Wave [Video]

Youtube preview

Author

Elliott Wave Forecast Team

Elliott Wave Forecast Team

ElliottWave-Forecast.com

More from Elliott Wave Forecast Team
Share:

Editor's Picks

AUD/USD treads water above 0.7000 ahead of the RBA

AUD/USD alternates gains with losses just above the 0.7000 yardstick ahead of the opening bell in Asia on Tuesday. The pair’s decline follows the Greenback’s decent advance in a context of heightened geopolitical effervescence. Moving forward, the RBA is expected to hike its OCR to 4.60%.

USD/JPY climbs back toward 158.00 after BoJ minutes amid firm USD

USD/JPY finds dip-buyers and reverses part of Friday's slide driven by speculation that authorities will step in again to prop up the Japanese Yen. However, the BoJ's dovish Minutes cap the JPY. Meanwhile, the US Dollar regains traction as the US-Iran standoff supports crude oil prices, fueling inflation fears and reaffirming bets for an October Fed rate hike. This further supports the pair, driving it back toward 158.00.

Gold tumbles further; focus shifts to $4,100

Gold kicks in the week on the back foot, selling off to the vicinity of the $4,100 mark per troy ounce, levels last traded back in early August. The resurgence of geopolitical concerns in combination with the firmer US Dollar and rising US Treasury yields keep the yellow metal under heavy pressure on Monday.

Strategy buys 1,665 Bitcoin amid renewed geopolitical tensions
Bitcoin (BTC) dropped below $84,000 on Monday as Strategy (MSTR) announced a fresh treasury purchase of $143 million last week, boosting its holdings to 847,666 BTC. The company purchased 1,665 BTC for roughly $142.7 million, according to a filing with the Securities and Exchange Commission (SEC) on Monday.
The week ahead: A key moment for the global economy as threats rise

UK diesel hits a record, as economic concerns rise. The market expects an aggressive Fed rate hiking cycle, but is it necessary? Oil supply concerns ease, even as oil prices rise. What’s next for the AI trade.

Fed vs BoJ: Both hiked. The market only believes one of them – and the chart shows which

The Fed and the BoJ have just done something remarkably similar. Both central banks raised interest rates by 25 bps last week, both are confronting inflation risks, and both signal that future decisions will depend on incoming economic data.