CVX is charging into a two-decade resistance line —Here’s what happens next

Chevron Corporation (NYSE: CVX) has been one of the standout stories of 2026. The integrated energy giant operates massive upstream operations spanning the Permian Basin, Guyana, and Kazakhstan. CVX has surged nearly 27% year-to-date, fueled by spiking crude prices amid escalating Middle East conflict and a high-profile boost from Berkshire Hathaway's recent accumulation of shares.
But as compelling as the fundamental tailwinds are, the monthly chart is flashing a technical signal that every trader following CVX needs to see right now. Price is approaching a resistance trendline that has been in place for nearly two decades.
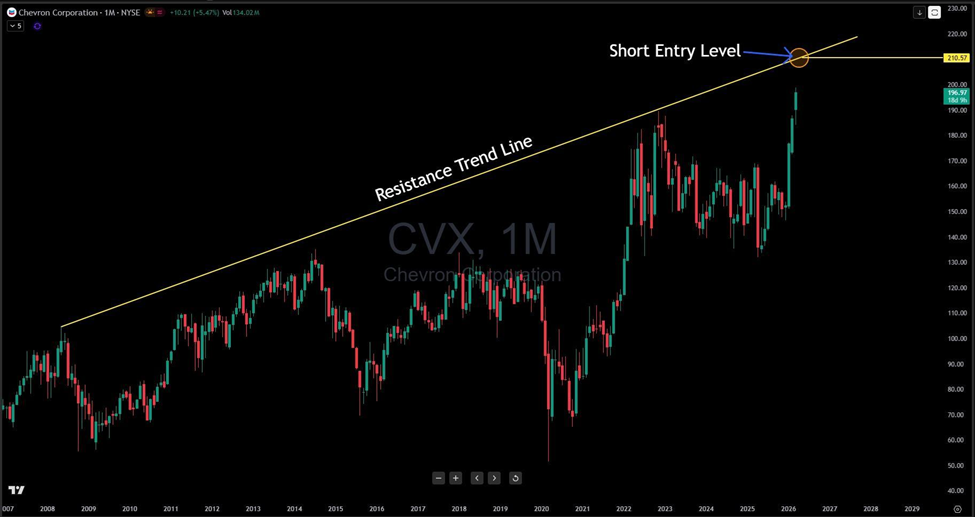
Zoom out on the 1-month chart and the picture comes into focus. Since approximately 2007, an ascending resistance trendline has connected the major swing highs across multiple market cycles — through the post-financial crisis recovery, the 2018 energy surge, and beyond. This isn't a line drawn between two arbitrary peaks. It's a structural boundary that has turned price away again and again over nearly 20 years, and right now, CVX is knocking on that door once more.
The current monthly candle is trading around $196.97, and based on where that trendline intersects with price today, the short entry level is marked at $210.57. That's the zone where the trendline resistance meets price. It’s a level we're watching as a potential inflection point rather than a breakout signal.
So what are the two scenarios from here?
If CVX continues higher and tags the $210.57 area, that trendline becomes the line in the sand. Bears watching this setup would look for a confirmed rejection at or near that level, with a monthly close back below it serving as the trigger. A sustained rollover from multi-decade resistance could open the door to a meaningful retracement: back toward the $160–$170 range would be a reasonable first area of interest on a failed breakout.
The bull case is straightforward but requires patience. A monthly close above $210.57 — not an intraday pierce, but a confirmed close — would represent a genuine breakout of a structure that has held for the better part of two decades. That would be a significant development and would shift the technical picture meaningfully in favor of the bulls.
Risk management here is non-negotiable. If you're watching the short setup and CVX closes the month above $210.57, the thesis is invalidated. Respect it and move on.
For traders and longer-term investors alike, CVX is offering one of the cleaner macro-level setups in the energy space. The fundamentals are strong, the momentum is real — but this trendline has earned its reputation. Keep it on your radar.
Author

Benjamin Pool
Verified Investing
A seasoned financial expert with a passion for empowering individuals to mastering smart money management.

















