Crude Oil runs out of war and out of buyers
- WTI has round-tripped the entire war premium and now sits just above its February base.
- OPEC+ lifted quotas again for August while actual Gulf output is still catching up.
- The Brent curve's slip into contango frames Wednesday's EIA inventory data as the week's main test.

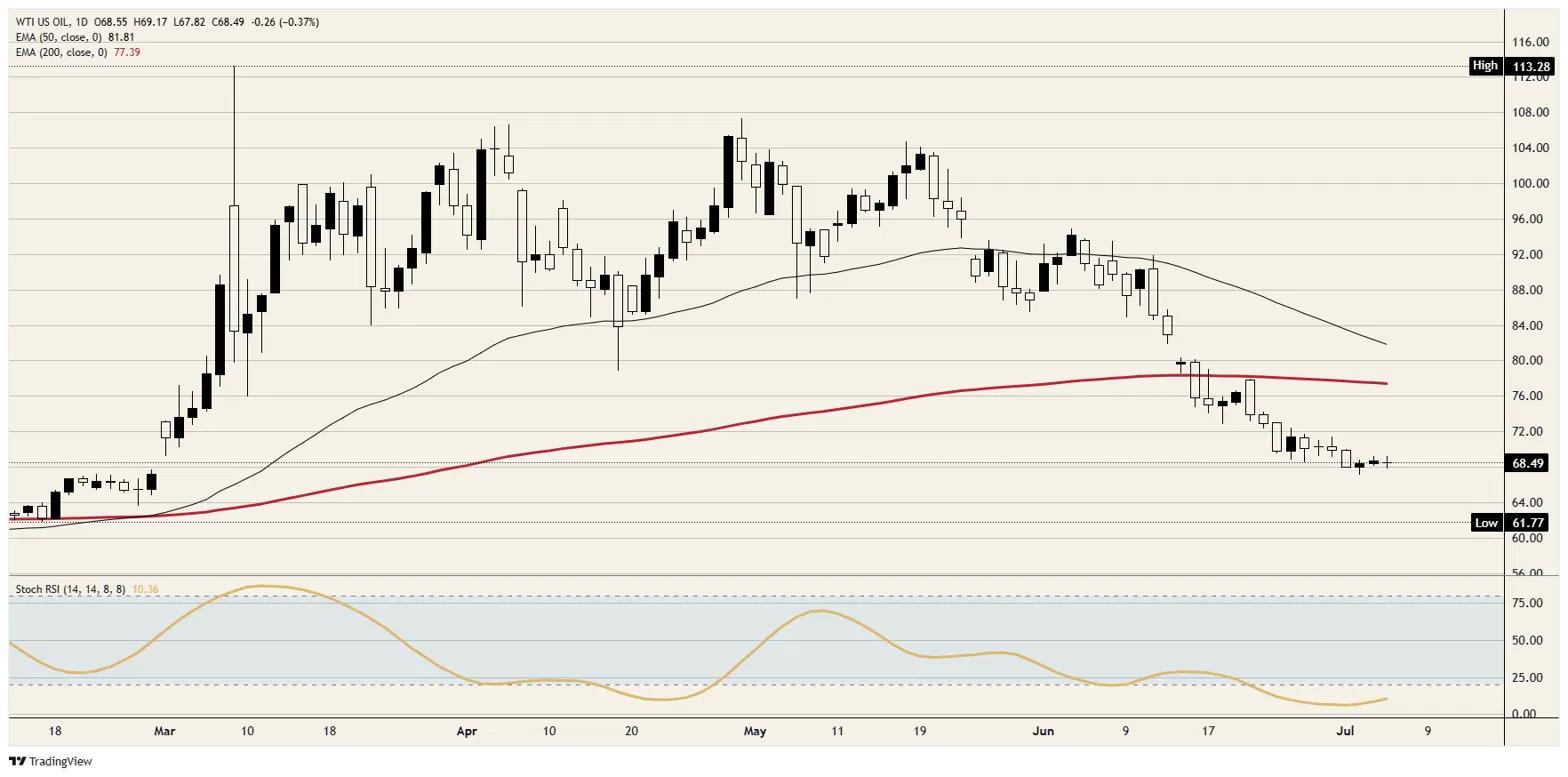
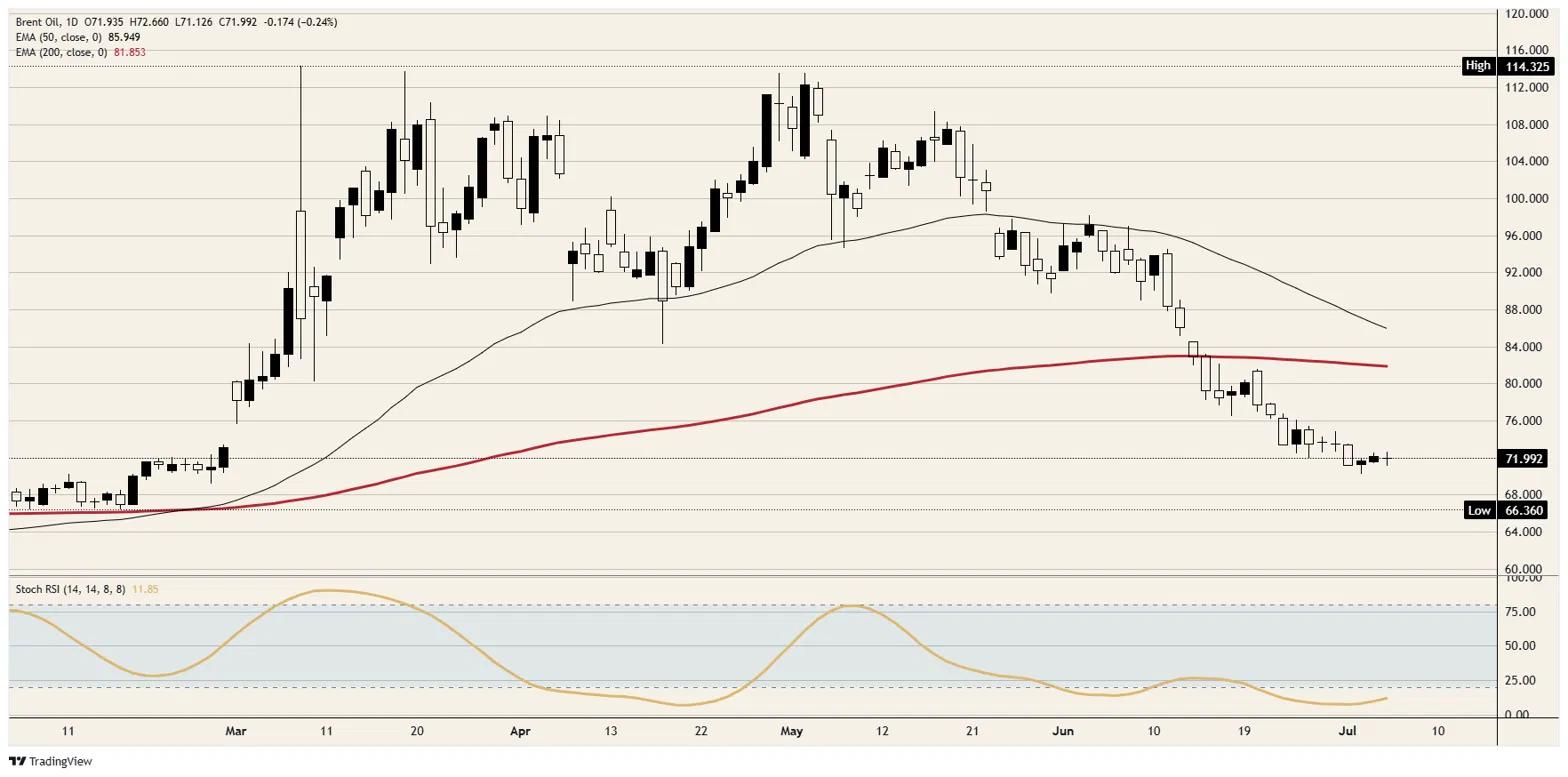
West Texas Intermediate (WTI) has spent three weeks handing back what the war spent three months building, and the tape now reads as though February never ended. The US benchmark drifts near $68.50 while Brent hovers close to $72.00, both a couple of dollars above their pre-war bases and nearly 40% below the March extremes.
The candles have been shrinking for a week and the ranges with them, which tells you the momentum did not fade so much as leave with the risk premium. The June 17 interim agreement between Washington and Tehran reopened the Strait of Hormuz to normal traffic, the fear trade was carried out of the building, and what remains is a market forced to price ordinary supply and demand for the first time this year. It does not appear thrilled by the exercise.
The differential says the war trade is closed
Brent's premium over WTI has settled near $3.50, which is plain freight-and-quality territory rather than anything resembling a risk premium. Seaborne barrels carried the fear through the war, and that gap has now compressed back to the boring arithmetic of pipelines versus tankers. Nobody is paying extra for Brent's postcode anymore, and the differential is the cleanest single gauge that the geopolitical bid has been fully extracted.
Everyone is selling into the reunion
The Organization of the Petroleum Exporting Countries (OPEC) and its allies, collectively OPEC+, agreed on Sunday to add another 188K barrels per day (bpd) to August quotas, the latest step in restoring 940K bpd of paper supply since the war began. Actual output still lags the paperwork, with the biggest Gulf producers having lost around 6 million bpd at the worst of the closure, though flows have been recovering since the June agreement. The United Arab Emirates has meanwhile walked away from the quota system altogether, Washington is still working through a 172 million barrel release from the Strategic Petroleum Reserve (SPR) agreed during the war, and US production set a record near 14 million bpd in May.
The curve said the quiet part
The Brent futures curve tipped into contango last week for the first time this year, with the six-month spread near minus 56 cents; when the market pays you to store barrels, it is telling you it has too many of them. OPEC's own monthly report has trimmed 2026 demand growth in back-to-back months, to under 1 million bpd, so the supply wave is arriving into a shrinking demand forecast. Strategists have begun sketching Brent into the 60s by year-end, and for once the futures market is not arguing with them.
Wednesday brings the receipts
Weekly inventory data from the Energy Information Administration (EIA) lands Wednesday at 14:30 GMT, the first clean read on stockpiles since Hormuz traffic began normalizing, after industry figures Tuesday evening. Minutes from the June Federal Open Market Committee (FOMC) meeting arrive the same day at 18:00 GMT; a hawkish Federal Reserve (Fed) keeps the Dollar bid, and Dollar-priced barrels do not enjoy that. OPEC+ ministers reconvene on August 2, where a compensation-hungry Iraq is already agitating for a bigger quota.
Levels to watch
Resistance: WTI's first hurdle is the $70.00 handle, with the June breakdown shelf near $72.00 behind it; Brent faces the same test at $74.00. Reclaiming those levels on a daily close is the minimum before anyone argues the flush is finished.
Support: Initial demand sits close to $67.50 for WTI and around $71.00 for Brent, the floors of the past week's drift. Below there, $65.00 is the only round figure of note before the February bases near $62.00 for WTI and $66.50 for Brent, where this entire journey started.
Bias: Bearish. The Stochastic Relative Strength Index (Stoch RSI) has been pinned near its floor for two weeks while price keeps leaking, and oversold in a downtrend is a description, not a buy signal. With quotas rising, the reserve draining, and the curve paying for storage, rallies toward $70.00 are for selling; only a daily close back above $72.00 changes the conversation, while a break of $67.50 puts the February base on the table.
WTI daily chart
Brent daily chart
WTI Oil FAQs
WTI Oil is a type of Crude Oil sold on international markets. The WTI stands for West Texas Intermediate, one of three major types including Brent and Dubai Crude. WTI is also referred to as “light” and “sweet” because of its relatively low gravity and sulfur content respectively. It is considered a high quality Oil that is easily refined. It is sourced in the United States and distributed via the Cushing hub, which is considered “The Pipeline Crossroads of the World”. It is a benchmark for the Oil market and WTI price is frequently quoted in the media.
Like all assets, supply and demand are the key drivers of WTI Oil price. As such, global growth can be a driver of increased demand and vice versa for weak global growth. Political instability, wars, and sanctions can disrupt supply and impact prices. The decisions of OPEC, a group of major Oil-producing countries, is another key driver of price. The value of the US Dollar influences the price of WTI Crude Oil, since Oil is predominantly traded in US Dollars, thus a weaker US Dollar can make Oil more affordable and vice versa.
The weekly Oil inventory reports published by the American Petroleum Institute (API) and the Energy Information Agency (EIA) impact the price of WTI Oil. Changes in inventories reflect fluctuating supply and demand. If the data shows a drop in inventories it can indicate increased demand, pushing up Oil price. Higher inventories can reflect increased supply, pushing down prices. API’s report is published every Tuesday and EIA’s the day after. Their results are usually similar, falling within 1% of each other 75% of the time. The EIA data is considered more reliable, since it is a government agency.
OPEC (Organization of the Petroleum Exporting Countries) is a group of 12 Oil-producing nations who collectively decide production quotas for member countries at twice-yearly meetings. Their decisions often impact WTI Oil prices. When OPEC decides to lower quotas, it can tighten supply, pushing up Oil prices. When OPEC increases production, it has the opposite effect. OPEC+ refers to an expanded group that includes ten extra non-OPEC members, the most notable of which is Russia.
Author

Joshua Gibson
FXStreet
Joshua joins the FXStreet team as an Economics and Finance double major from Vancouver Island University with twelve years' experience as an independent trader focusing on technical analysis.