|

Costco (COST) looking for break out for targeting $1515
Costco Wholesale Corporation., (COST) engages in the operation of membership warehouse in the United States & globally together with its subsidiaries. It offers branded & private-label products in the range of merchandise categories. It also operates e-commerce websites in the US, Canada, UK & many other countries. It comes under Consumer Defensive sector & trades as “COST” ticker at Nasdaq.

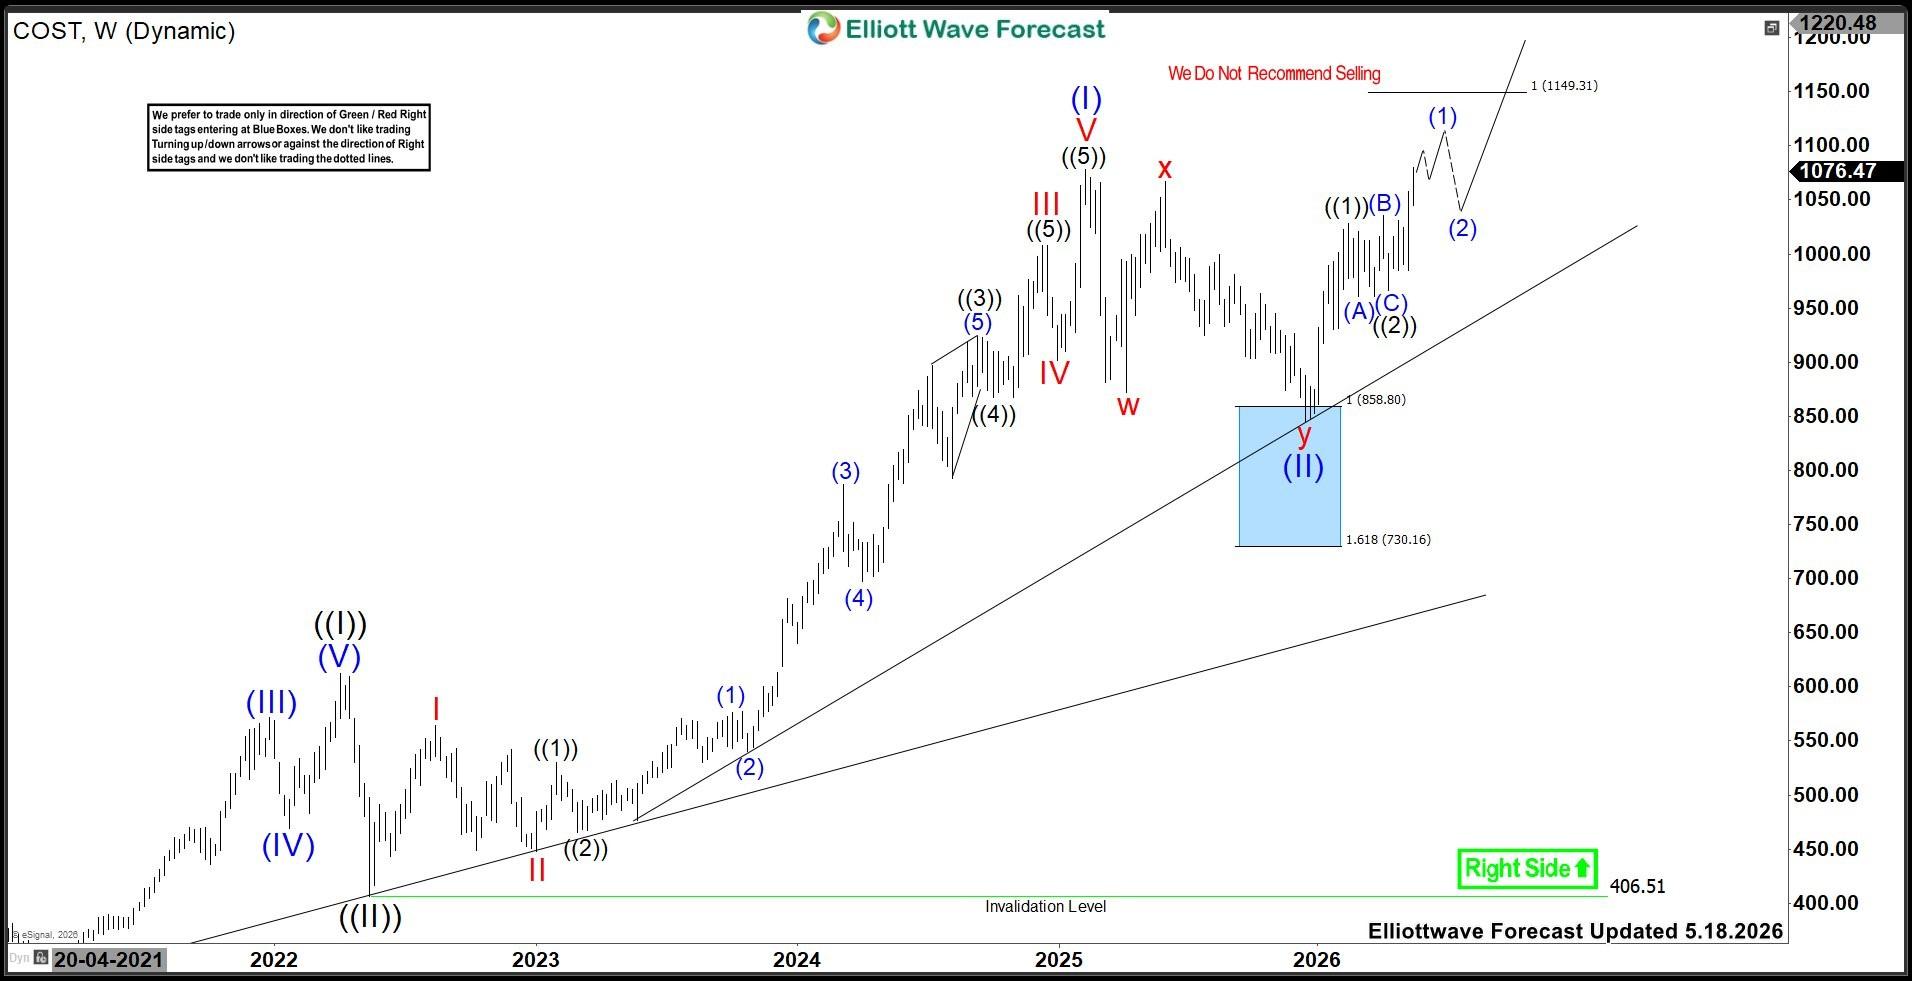
In weekly, COST is bullish nested impulse sequence & expect rally against May-2022 low, while dips remain above $844.06 low. It is close to break above February-2025 high of $1080. Once it breaks above that level, buyers should buy the pullback for targeting $1515 or higher.

COST – Elliott Wave latest weekly view
Chart

It ended ((I)) in weekly at $612.27 high in April-2022 & ((II)) at $406.51 in May-2022. Above there, it ended (I) of ((III)) at $1078.23 high in February-2025 high & (II) at $844.06 low. Within (I), it placed I at $564.75 high, II at $447.90 low, III at $1008.25 high, IV at $902 low & V at $1078.23 high as (I). Within III, it ended ((1)) at 530.05 high, ((2)) at $465.33 low, ((3)) at $923.83 high, ((4)) at $867.16 low & ((5)) at $1008.25 high. The (I) was having extended III wave, which indicates the strength of the trend. In (II) pullback, it ended w at $871.71 low, x at $1067.08 high & y at $844.06 low in blue box area.

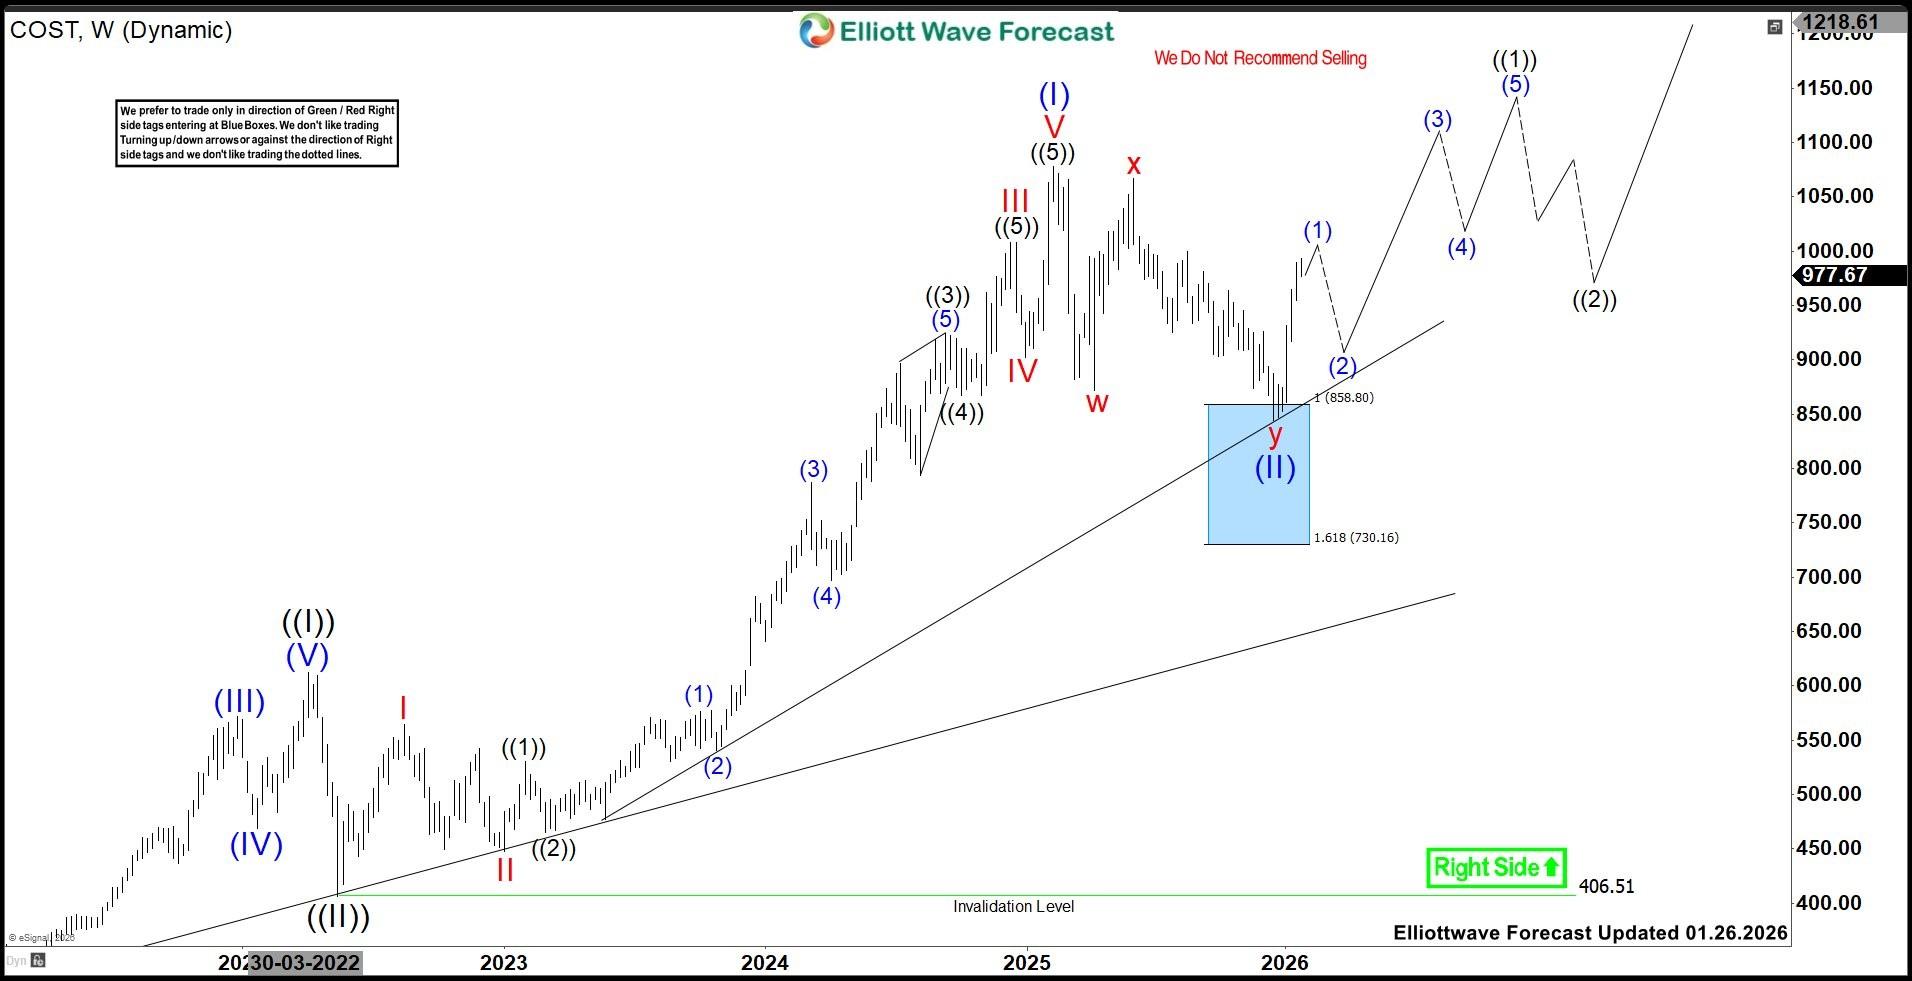
COST – Elliott Wave view from 1.26.2026
Chart

Above (II) low, it favors rally in I of (III), which confirms above 2.10.2025 high. Above $844.06 low, it ended ((1)) of I at $1028.44 & ((2)) as flat correction at $966 low. It placed (A) of ((2)) at $960.46 low, (B) at $1035.82 high & (C) at $966 low. It already broke above ((1)) high, favoring upside in (1) of ((3)). It expects two or more highs within 4.13.2026 rally to extend (1) before correcting next. The ((3)) can extend into $1149.3 – 1262.4 area before correcting in ((4)). Once it breaks above February-2025 high, we like to buy the pullback in 3, 7 or 11 swings at extremes. If it fail to break above February-2025 high, it can remain choppy or do larger correction in (II) if breaks below Dec-2025 low.

Author

Elliott Wave Forecast Team

Elliott Wave Forecast Team

ElliottWave-Forecast.com

More from Elliott Wave Forecast Team
Share:

Editor's Picks

GBP/USD alternates gains with losses near 1.3550

GBP/USD struggles to maintain the recent bull run and hovers around the 1.3550 zone on Tuesday. Cable’s irresolute price action follows the equally directionless performance of the Greenback, while the disheartening UK jobs data also seem to limit the upside.

EUR/USD climbs to daily highs past 1.1580

EUR/USD keeps the current bullish tone well in place and approaches the 1.1600 region on turnaround Tuesday. Indeed, the pair advances for the fourth day in a row amid the lack of direction in the US Dollar, steady uncertainty in the geopolitical landscape and diminishing bets for further Fed rate hikes.

Gold challenges $4,400 amid modest losses

Gold faces some fresh selling pressure and retreats modestly to the area below the $4,400 mark per troy ounce after two consecutive daily advances. The precious metal’s correction comes in tandem with the absence of direction in the US Dollar, declining US Treasury yields across the curve and continuous uncertainty in the Middle East crisis.

Crypto Today: Bitcoin, Ethereum, XRP falter amid escalating US-Iran tensions

Cryptocurrency prices are broadly correcting on Tuesday, with Bitcoin edging lower toward $64,000. Ethereum shows weakness amid ongoing narrow-range consolidation, while Ripple trades below $1.00, weighed down by falling technical indicators.

Fiscal concerns and doubts on Fed independence send US yields to long-term highs

US Treasury yields keep rising across the curve this week, with the yield for the 30-year Treasury bond reaching its highest level since 2007, during the global financial crisis, at 5.33% so far on Monday. A mix of concerns about the ballooning US fiscal deficit and growing doubts about the Federal Reserve’s Independence are increasing pressure on US Government Bonds.

Why is Crude Oil priced for a reopening the ships haven't made?
Fourteen vessels crossed the Strait of Hormuz on Tuesday. Before the war, the count ran near 120 a day. In the sessions since the waterway was publicly declared open, Brent has drifted back to $87 and West Texas Intermediate (WTI) to $81, both a little lower again on Wednesday, with daily momentum on each unwound from the top of its range in late July to the low twenties now.