CAR Elliott Wave technical analysis [Video]
![CAR Elliott Wave technical analysis [Video]](https://editorial.fxstreet.com/images/Markets/Equities/Industries/HouseholdProducts/pic-house-cleaning-637435388243937071.jpg)
ASX: CAR GROUP LIMITED – CAR Elliott Elliott Wave Technical Analysis TradingLounge.
Greetings, Our Elliott Wave analysis today updates the Australian Stock Exchange (ASX) CAR GROUP LIMITED – CAR. We see ASX:CAR continuing to push lower in the coming period with wave (4)-orange, then wave (5)-orange will return to push higher.
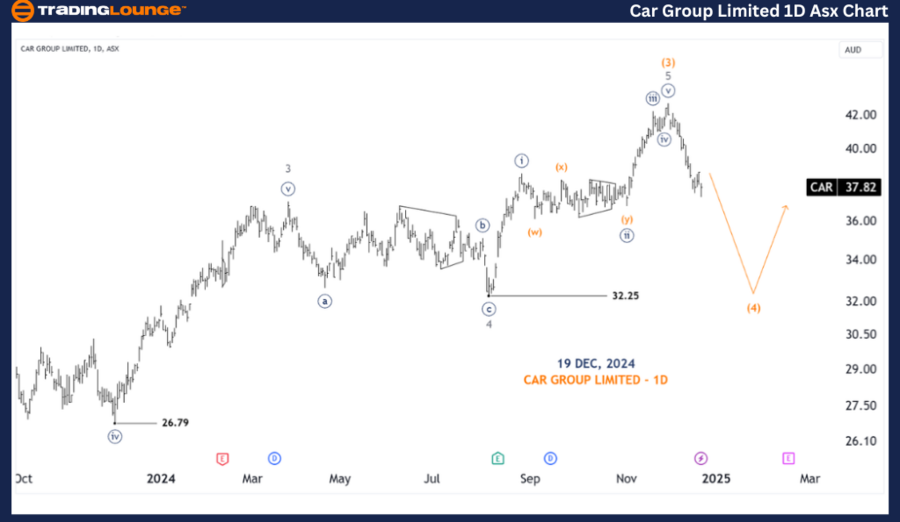
CAR one day chart (semilog scale) analysis
Function: Major trend (Intermediate degree, grey).
Mode: Motive.
Structure: Impulse.
Position: Wave (4)-orange.
Details: Wave (3)-orange should have ended recently as I got from wave 1-grey to wave 5-grey, so that's a warning bell that wave (4)-orange is unfolding to push significantly lower, targeting around 32.25, after which wave (5)-orange could return to move even higher.
Invalidation point: The end of Wave (3)-orange.
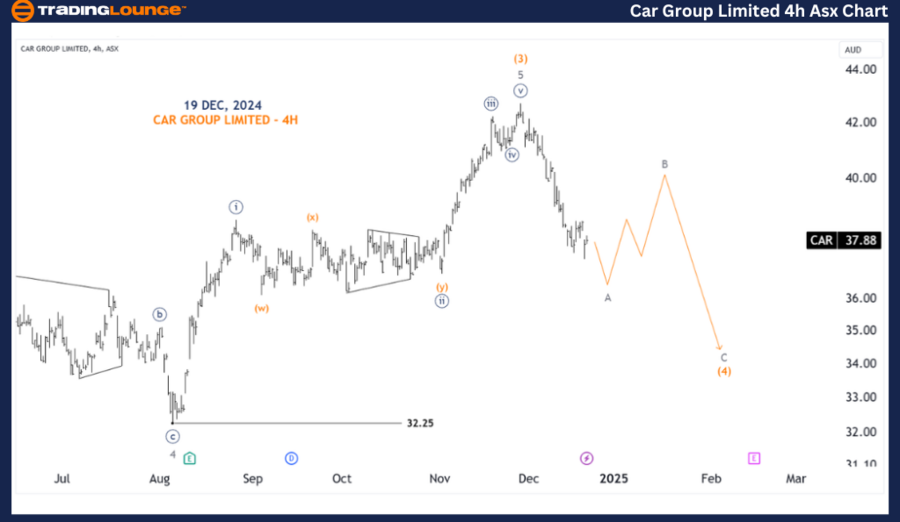
CAR four-hour chart analysis
Function: Major trend (Minor degree, grey).
Mode: Motive.
Structure: Impulse.
Position: Wave A-grey of Wave (4)-orange.
Details: A closer look at the (4)-orange wave initially shows that this is a sharp and fast decline, like wave A in a Zigzag, so this entire corrective wave pattern will probably develop as a 5-3-5, then wave B-grey pushes a little higher, and then finally wave C-grey will continue to push lower.
Invalidation point: The end of Wave (3)-orange.
Conclusion:
Our analysis, forecast of contextual trends, and short-term outlook for ASX: CAR GROUP LIMITED – CAR aim to provide readers with insights into the current market trends and how to capitalize on them effectively. We offer specific price points that act as validation or invalidation signals for our wave count, enhancing the confidence in our perspective. By combining these factors, we strive to offer readers the most objective and professional perspective on market trends.
Technical analyst: Hua (Shane) Cuong, CEWA-M (Master’s Designation).
CAR chart analysis [Video]
Author

Peter Mathers
TradingLounge
Peter Mathers started actively trading in 1982. He began his career at Hoei and Shoin, a Japanese futures trading company.


