|

Bearish Sequence Pressures Oil (CL) lower [Video]

Light Crude Oil (CL) has decisively broken below the April 2025 low of $55.12. This breach confirms a continuation of the bearish sequence that has persisted since the March 2022 peak. The short-term decline from the October 24, 2025 high is unfolding in the form of a five-wave Elliott Wave impulse, which provides a clear structural framework for the ongoing weakness.

From the October 24 peak, wave ((i)) concluded at $57.10. The subsequent rally in wave ((ii)) developed as a zigzag Elliott Wave structure. Within this corrective phase, wave (a) terminated at $59.97, wave (b) ended at $58.28, and wave (c) advanced to $60.50. This final push completed wave ((ii)) at a higher degree, setting the stage for renewed downside pressure.

Light Crude Oil (CL) 60-Minute Elliott Wave chart from 12.17.2025

Chart

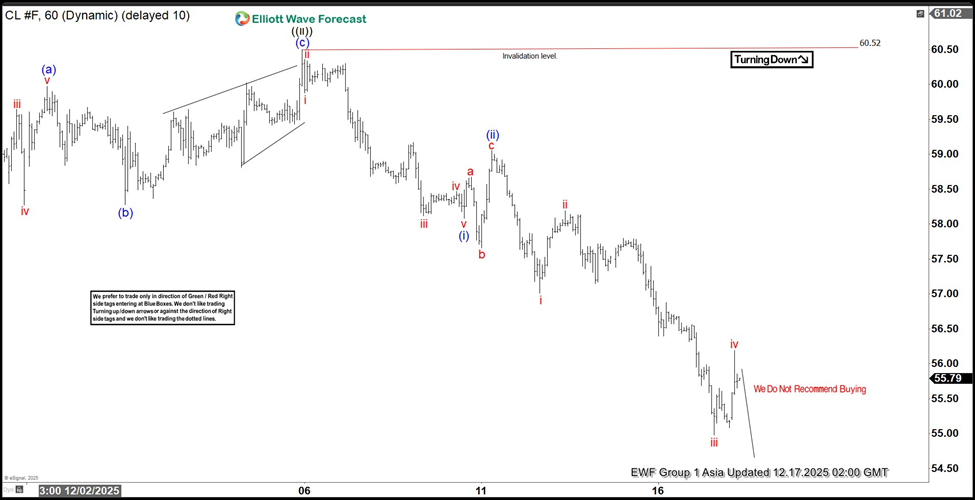
Oil then turned lower in wave ((iii)). From the termination of wave ((ii)), wave (i) ended at $58.08, while the rally in wave (ii) reached $59.05. The decline in wave (iii) is now progressing as an impulse of lesser degree. Within this sequence, wave i ended at $57.01, wave ii rallied to $58.19, and wave iii dropped sharply to $54.98. A corrective bounce in wave iv extended to $59.19, but momentum remains tilted to the downside. Near term, as long as the pivot at $60.50 holds firm, rallies are expected to fail in corrective sequences of three, seven, or eleven swings. This technical condition suggests further weakness ahead, reinforcing the broader bearish outlook for crude oil prices.

CL Elliott Wave video

Youtube preview

Author

Elliott Wave Forecast Team

Elliott Wave Forecast Team

ElliottWave-Forecast.com

More from Elliott Wave Forecast Team
Share:

Editor's Picks

EUR/USD strives to gain ground near 1.1770 on improving dovish Fed prospects

The EUR/USD pair attempts to regain ground near 1.1770 during the Asian trading session on Friday. The major currency pair attracts slight bids as the US Dollar ticks down amid an improvement in speculation that the Federal Reserve could cut interest rates in the March policy meeting.

GBP/USD trades above 1.3500 after rebounding from 50-day EMA

GBP/USD rebounds after two days of gains, trading around 1.3560 during the Asian hours on Friday. The technical analysis of the daily chart points to a potential bearish reversal as the pair is positioned near the lower boundary of an ascending channel pattern.

Gold rallies amid flight to safety, Fed rate cut bets

Gold builds on its goodish intraday bounce from the vicinity of mid-$4,600s, or a four-day low touched during the Asian session, and climbs to a fresh daily high in the last hour. A turnaround in the risk sentiment drives flow toward traditional safe-haven assets and acts as a tailwind for the commodity.

Bitcoin, Ethereum and Ripple sink to multi-month lows

Bitcoin, Ethereum and Ripple slip to multi-month lows, erasing all gains since crypto-friendly candidate Donald Trump won the US presidential election in November 2024. BTC hits a low of $60,000 on Friday, while ETH nosedives to $1,750 and XRP to $1.11.

The AI mirror just turned on tech and nobody likes the reflection

Tech just got hit with a different kind of selloff. Not the usual rates tantrum, not a recession whisper, not even an earnings miss in the classic sense. This was the market staring into an AI mirror and recoiling at its reflection.

Solana Price Forecast: SOL sell-off intensifies as BTC drops to $60,000

Solana (SOL) price extends its correction, slipping below $70 on Friday after posting losses of over 23% so far this week. The sell-off was fueled by broader weakness in the crypto market, with Bitcoin (BTC) reaching a low of $60,000 on Friday.