|

Baidu (BIDU) prepares for a bullish: Turnaround below $100

Baidu (NASDAQ: BIDU) has declined 20% year-to-date, underperforming the broader market. However, the stock now shows signs of bottoming. Today, we analyze the Elliott Wave structure behind this pullback. Our analysis reveals BIDU is approaching its next technical reversal zone. We also explain the potential bullish path ahead for the stock.

Elliott Wave analysis

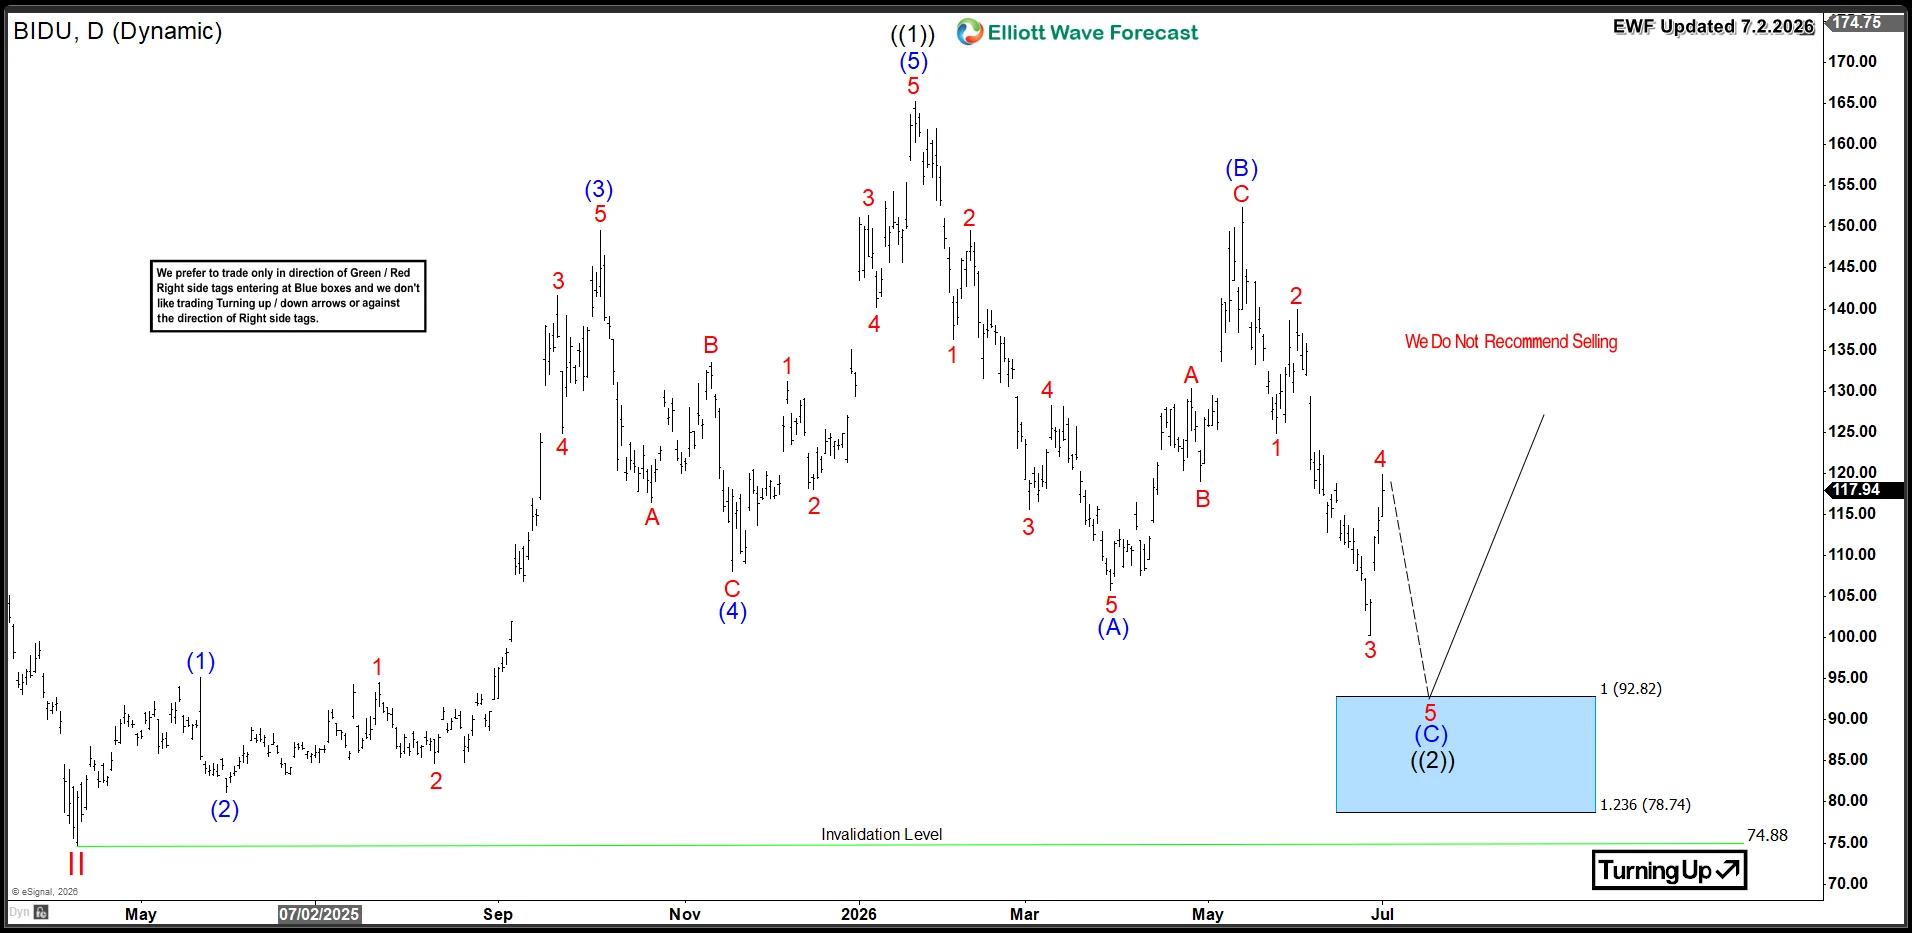
BIDU completed a 5‑wave rally from April 2025 low, peaking at $165. The stock then began a 3‑wave Zigzag correction. Wave (A) dropped to $106, followed by wave (B) rebound to $152. Wave (C) continues lower, still unfolding.

The decline in wave (C) needs another leg down to complete 5 waves, ideally reaching the $92–$78 Blue Box area where buyers often step in at equal legs extreme zones. This area should spark a bullish reversal that could launch a new upside cycle or at minimum trigger a 3‑wave bounce correcting the entire decline.

BIDU Daily Chart 7.2.2026
Conclusion

Baidu’s daily correction is entering its final phase, with a potential dip below $100 to complete the move lower and reach the buying area, so traders should focus on strategic entry points during this corrective dip while anticipating a reversal by year end.

Author

Elliott Wave Forecast Team

Elliott Wave Forecast Team

ElliottWave-Forecast.com

More from Elliott Wave Forecast Team

Share:

Editor's Picks

GBP/USD hits multi-week tops around 1.3560

GBP/USD gathers fresh steam and advances to new three-month peaks near the 1.3560 zone on Friday. Cable’s sharp move higher comes after three daily drops in a row and follows the increasing selling pressure hurting the Greenback.

EUR/USD pops to fresh two-month highs, targets 1.1600

EUR/USD advances markedly, revisiting the upper 1.1500s for the first time since mid-June. The pair’s sharp uptick comes on the back of a strong retracement in the US Dollar amid BoJ intervention chatter and despite steady uncertainty in the Middle East.

Gold extends its struggle with $4,400, but bullish bias intact

Gold is holding the previous recovery from near $4,300 on early Monday, struggling around the key $4,400 level. However, buyers retain control as the new week kicks in, with all eyes on the Middle East updates and the Minutes of the US Federal Reserve July monetary policy meeting.

BTC/USD price outlook: Bitcoin navigating between arc levels. Potential continuation toward $58,000
Overview: Based on Arc Cycle Analysis applied to the 1D chart, Bitcoin is trading between the 0.5 Arc and 0.618 Arc within the current Arc Cycle. Price has cleared the 0.5 Arc and is progressing toward the 0.618 Arc, suggesting continued movement toward the next Arc boundary. Metric
US Dollar Weekly Forecast: Economic cracks challenge Fed rate bets

It was a strange week for the US Dollar: while the geopolitical situation has remained largely unchanged, with the usual back-and-forth between the US, Iran, and occasional third parties, disappointing domestic data have re-emerged, reducing expectations of potential tightening by the Federal Reserve in the next few months.

Why is Crude Oil priced for a reopening the ships haven't made?
Fourteen vessels crossed the Strait of Hormuz on Tuesday. Before the war, the count ran near 120 a day. In the sessions since the waterway was publicly declared open, Brent has drifted back to $87 and West Texas Intermediate (WTI) to $81, both a little lower again on Wednesday, with daily momentum on each unwound from the top of its range in late July to the low twenties now.