|

BABA showing perfect reaction higher from the blue box area

In this technical blog, we will look at the past performance of 1-hour Elliott Wave Charts of Ali Baba ticker symbol: $BABA. We presented to members at the elliottwave-forecast. In which, the rally from the 23 December 2022 low unfolded as an impulse structure. And showed a higher high sequence favored more upside extension to take place. Therefore, we advised members not to sell the stock & buy the dips in 3, 7, or 11 swings at the blue box areas. We will explain the structure & forecast below:

BABA 1 hour Elliott Wave chart
BABA

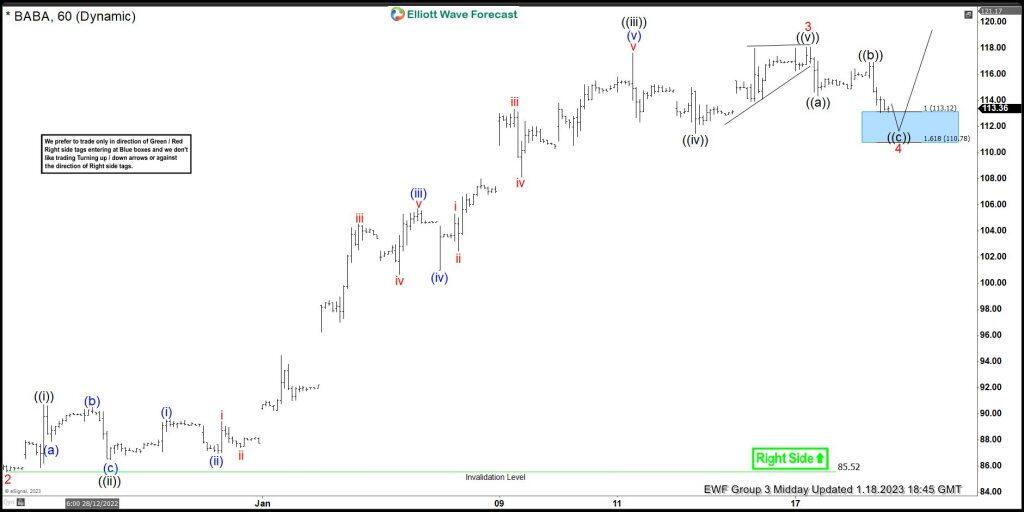
Here’s 1hr Elliott wave chart from the 1/18/2023 Midday update. In which, the cycle from the 12/23/2022 low ended in wave 3 as an impulse structure at $118.10 high. Down from there, the stock made a pullback in wave 4 to correct that cycle. The internals of that pullback unfolded as Elliott wave zigzag structure where wave ((a)) at $114.34 low. Wave ((b)) ended at $116.93 high and wave ((c)) managed to reach the blue box area at $113.12- $110.78 area. From there, buyers were expected to appear looking for the next leg higher or for a 3 wave bounce minimum.

BABA 1 hour Elliott Wave chart
BABA

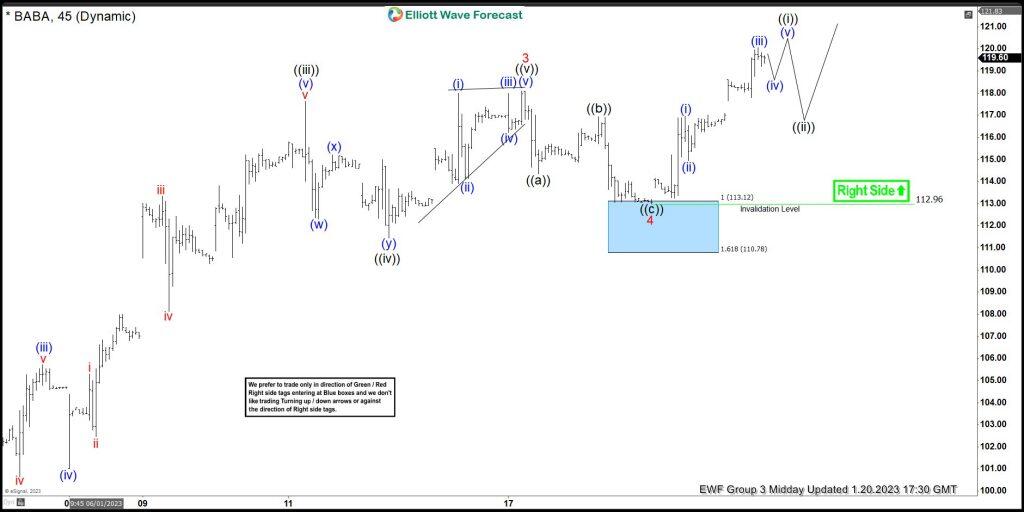
This is the 1hr Elliott wave Chart from the 1/20/2023 Midday update. In which the stock is showing a strong reaction higher taking place, right after ending the zigzag correction within the blue box area. Allowed members to create a risk-free position shortly after taking the long position at the blue box area.

Author

Elliott Wave Forecast Team

Elliott Wave Forecast Team

ElliottWave-Forecast.com

More from Elliott Wave Forecast Team
Share:

Editor's Picks

AUD/USD looks bid; retargets 0.7000

AUD/USD has managed to regain the 0.6900 hurdle and beyond in quite an auspicious start to the new trading week. The pair’s marked recovery has come on the back of the resurgence of the geopolitics-led selling pressure on the Greenback ahead of the release of key US CPI prints on Tuesday.

USD/JPY retreat in sync with USD, appraches 158.00

USD/JPY is back in the red at the start of the week on Monday, eyeing the broad US Dollar retreat amid easing US-Iran tensions. Traders also resorting to profit-taking following the blockbuster US Nonfarm Payrolls data-led rally. US CPI report is next in focus.

Gold keeps the bid tone near $4,100

Gold resumes its recovery on Monday, hovering around the $4,100 region per troy ounce. The precious metal’s solid performance comes amid fresh downside pressure on the US Dollar, rising US Treasury yields and a marked retracement in crude oil prices.

Ethereum Price Forecast: ETH drops to $2,100 as community debates Vitalik Buterin's SoV pitch
Ethereum (ETH) is down 4.6% on Monday as the crypto community debated co-founder Vitalik Buterin's argument that the top altcoin's long-term value should come from its store-of-value (SoV) properties rather than transaction fee burning.
Two Huangs don’t make a right: Nvidia CEO caught in scandal – NVDA slides

Nvidia CEO Jensen Huang sent employees an apology for being unfaithful to his wife, following reports that he may have been targeted in a foreign intelligence operation. Why is Nvidia trading roughly 5–6% below Friday’s close in the overnight market? And – more importantly – does this actually matter to the AI trade?

Gold reclaimed $4,100. Tuesday’s CPI test decides if it holds
Gold (XAU/USD) starts the week on a positive note, reclaiming the $4,100 psychological level as the US Dollar (USD) retreats from its recent highs. The precious metal recovers from Friday's losses, although investors remain cautious ahead of Tuesday's US Consumer Price Index (CPI) report, which could determine the next direction for Bullion.