Australian Dollar tumbles as risk aversion and Fed bets lift the USD
- Australian CPI data could reshape RBA tightening expectations.
- Tech-led equity rout drives safe-haven flows into Greenback.
- Strong US PMIs reinforce exceptionalism before Core PCE release.
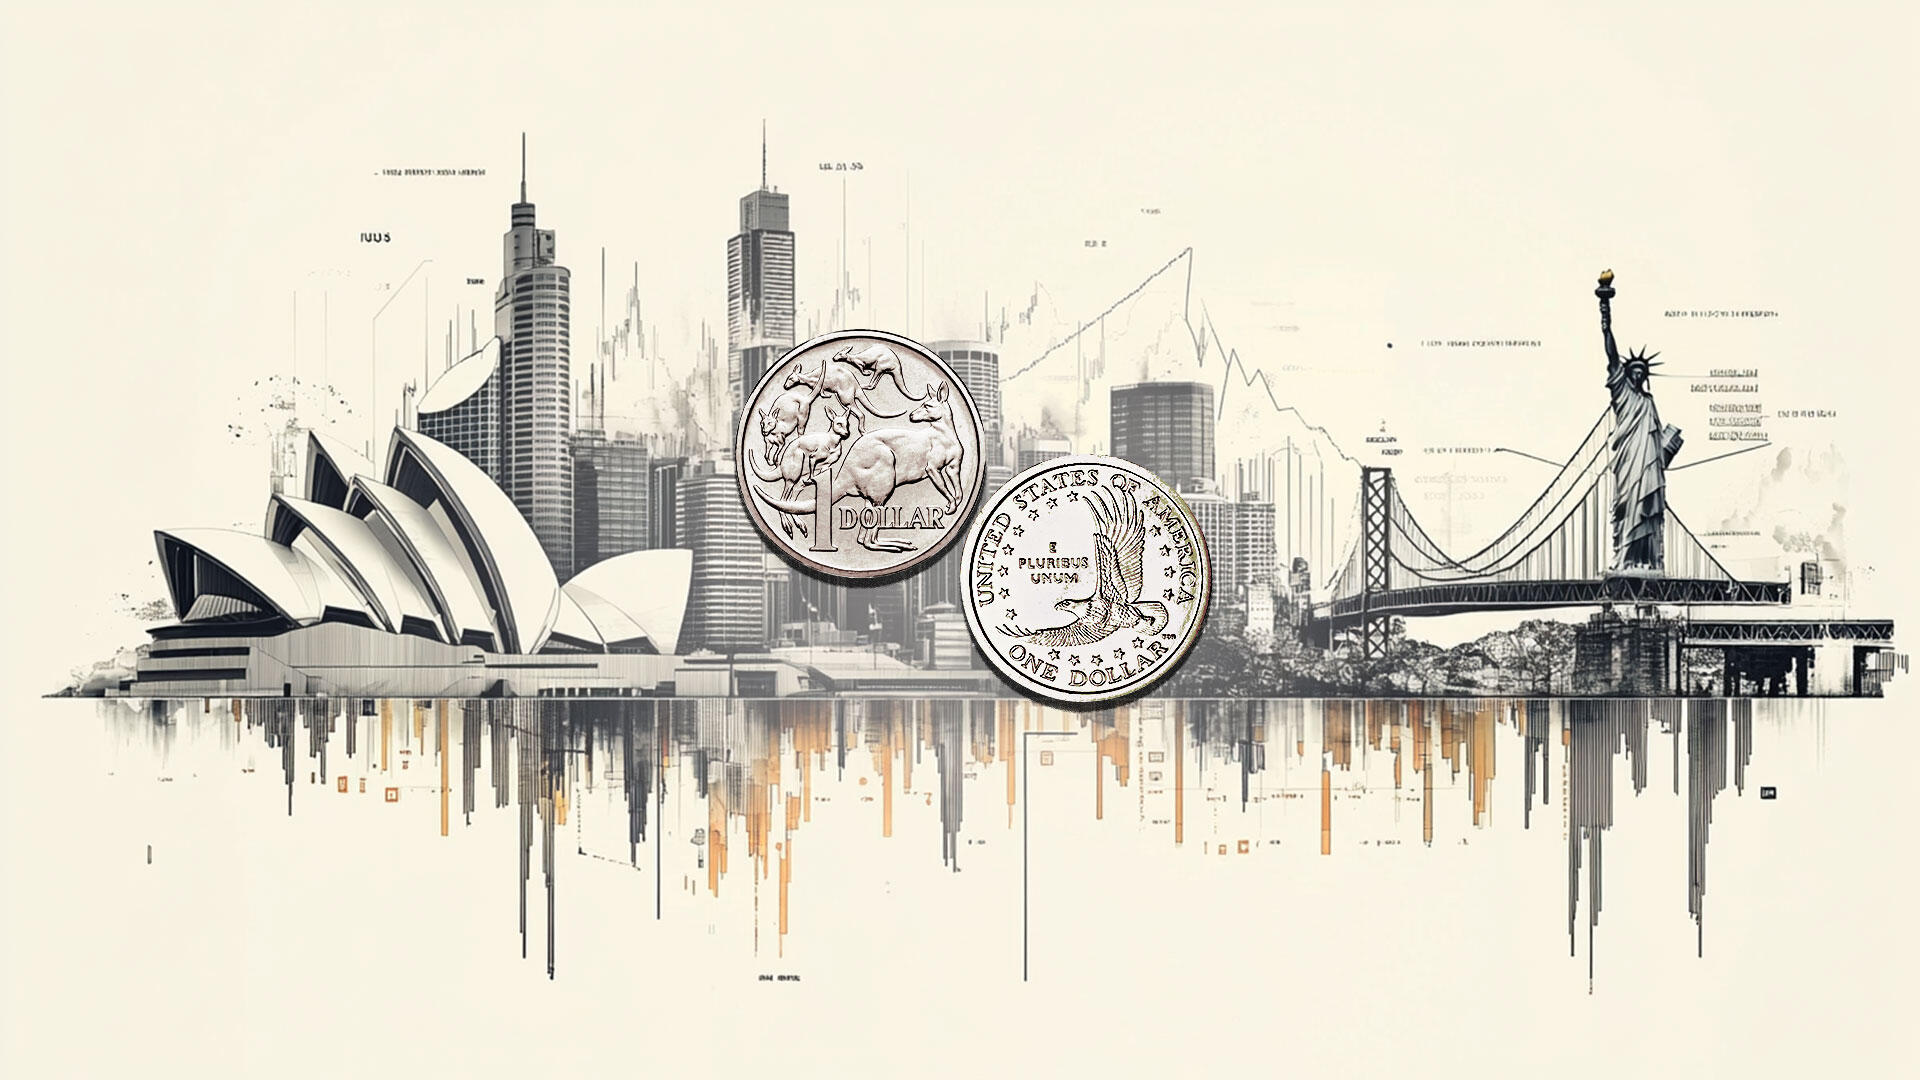
The Australian Dollar collapsed by over 1.20% on Tuesday as risk aversion favoured flows into the Greenback amid expectations of higher US interest rates, while the Aussie fell. The AUD/USD trades at 0.6915 after dropping from daily highs of 0.7005.
AUD/USD crashes as AI rout sparks US Dollar stampede
Worldwide equity markets tumbled on Tuesday as investors rotated out of high-tech companies, particularly AI-related ones, amid frothy valuations. This sent the Korean KOSPI tech index down over 10% and the Nasdaq down over 3%.
In the FX markets, the Greenback was the broad winner during the session, as the US Dollar Index (DXY), which tracks the buck’s value against six currencies, is up 0.39% at 101.38.
US data showed that business activity in June expanded healthily across both sectors, manufacturing and services, reaffirming US exceptionalism. Meanwhile, the US-Iran conflict talks continued, and there has been progress, according to Iran’s ambassador to the UN.
A definitive resolution to the conflict could push Oil prices to pre-war levels, tempering global inflationary woes. This can ease bond yields across G8 economies and prevent further tightening by major central banks, as money markets have priced in.
For 2026, investors are expecting the Federal Reserve to tighten by 34 basis points. The Reserve Bank of Australia (RBA) opted to hold rates unchanged at 4.35%, though it’s the only central bank that reversed its easing cycle, hiking rates by 75 bps in 2026.
In Australia, the economic schedule will feature the release of the Consumer Price Index (CPI) for May, which is expected to dip from 0.4% MoM to -0.3%, while the core print is projected to remain unchanged at 0.3% MoM. On an annual basis, the headline CPI is seen at 4.4%, up from 4.2%, while the core CPI is expected to tick a tenth higher to 3.5%.
The upcoming US economic calendar includes S&P Global Flash PMIs and housing data. Thursday's schedule is packed with reports on Q1 2026 GDP, the Fed’s preferred inflation indicator, the Core PCE Price Index, and Initial Jobless Claims.
AUD/USD Price Forecast: Technical outlook
In the daily chart, AUD/USD trades at 0.6914, extending a bearish near-term bias as spot holds well below the triple simple moving average (SMA) cluster, which now caps the pair around 0.7135. The rebound from higher levels has given way to a deeper setback that leaves price under all referenced moving averages and former rising trend supports, while the Relative Strength Index (14) slipping to about 28 suggests oversold conditions that may slow, but not yet reverse, the downside pressure.
On the topside, initial resistance is seen at the triple SMA area near 0.7135, with further barriers emerging at the reclaimed upward trend-line projections around 0.7189 and 0.7264, before more distant resistance at 0.7984 and 0.8487. On the downside, structural support is comparatively sparse, with the primary reference coming in near the prior downward trend-line break around 0.6436, where buyers could attempt to build a more durable floor if the decline extends.
(The technical analysis of this story was written with the help of an AI tool.)
Australian Dollar Price This week
The table below shows the percentage change of Australian Dollar (AUD) against listed major currencies this week. Australian Dollar was the strongest against the New Zealand Dollar.
| USD | EUR | GBP | JPY | CAD | AUD | NZD | CHF | |
|---|---|---|---|---|---|---|---|---|
| USD | 0.74% | -0.05% | 0.13% | 0.32% | 1.39% | 1.22% | 0.27% | |
| EUR | -0.74% | -0.79% | -0.53% | -0.38% | 0.70% | 0.43% | -0.45% | |
| GBP | 0.05% | 0.79% | 0.00% | 0.36% | 1.42% | 1.22% | 0.31% | |
| JPY | -0.13% | 0.53% | 0.00% | 0.13% | 1.23% | 1.05% | 0.08% | |
| CAD | -0.32% | 0.38% | -0.36% | -0.13% | 1.08% | 0.92% | -0.07% | |
| AUD | -1.39% | -0.70% | -1.42% | -1.23% | -1.08% | -0.20% | -1.10% | |
| NZD | -1.22% | -0.43% | -1.22% | -1.05% | -0.92% | 0.20% | -0.90% | |
| CHF | -0.27% | 0.45% | -0.31% | -0.08% | 0.07% | 1.10% | 0.90% |
The heat map shows percentage changes of major currencies against each other. The base currency is picked from the left column, while the quote currency is picked from the top row. For example, if you pick the Australian Dollar from the left column and move along the horizontal line to the US Dollar, the percentage change displayed in the box will represent AUD (base)/USD (quote).
Author

Christian Borjon Valencia
FXStreet
Markets analyst, news editor, and trading instructor with over 14 years of experience across FX, commodities, US equity indices, and global macro markets.