AUD/USD Price Forecast: Bulls eye 0.7200 as RSI nears overbought territory
- AUD/USD climbs to its highest level since June 3 as the Australian Dollar outperforms all its major peers.
- Broad US Dollar weakness, rising Gold prices and the RBA’s hawkish stance support the Aussie.
- The technical bias remains positive, although the daily RSI is now flirting with overbought territory.

AUD/USD edges higher on Friday, climbing to its highest level since June 3 as the Australian Dollar (AUD) outperforms all its major peers. A broadly weaker US Dollar (USD), strength across the commodity complex led by rising Gold (XAU/USD) prices, and the Reserve Bank of Australia’s (RBA) hawkish policy stance boost the commodity-linked Aussie.
At the time of writing, AUD/USD trades around 0.7167, up 0.77% on the day and on track for an eighth consecutive weekly gain. The intraday advance comes even as the US Dollar shows signs of stabilizing after its recent weakness. The US Dollar Index (DXY), which tracks the Greenback against a basket of six major currencies, trades around 98.82 after recovering from an intraday low of 98.56.
Australian Dollar Price Today
The table below shows the percentage change of Australian Dollar (AUD) against listed major currencies today. Australian Dollar was the strongest against the Swiss Franc.
| USD | EUR | GBP | JPY | CAD | AUD | NZD | CHF | |
|---|---|---|---|---|---|---|---|---|
| USD | 0.03% | 0.03% | -0.02% | -0.13% | -0.78% | -0.51% | 0.16% | |
| EUR | -0.03% | -0.00% | -0.07% | -0.20% | -0.82% | -0.53% | 0.13% | |
| GBP | -0.03% | 0.00% | -0.07% | -0.19% | -0.80% | -0.54% | 0.14% | |
| JPY | 0.02% | 0.07% | 0.07% | -0.11% | -0.76% | -0.50% | 0.19% | |
| CAD | 0.13% | 0.20% | 0.19% | 0.11% | -0.65% | -0.37% | 0.30% | |
| AUD | 0.78% | 0.82% | 0.80% | 0.76% | 0.65% | 0.26% | 0.95% | |
| NZD | 0.51% | 0.53% | 0.54% | 0.50% | 0.37% | -0.26% | 0.69% | |
| CHF | -0.16% | -0.13% | -0.14% | -0.19% | -0.30% | -0.95% | -0.69% |
The heat map shows percentage changes of major currencies against each other. The base currency is picked from the left column, while the quote currency is picked from the top row. For example, if you pick the Australian Dollar from the left column and move along the horizontal line to the US Dollar, the percentage change displayed in the box will represent AUD (base)/USD (quote).
The technical outlook also supports the bullish case, with AUD/USD forming a steady sequence of higher highs and higher lows since rebounding from the mid-0.6800s in late June.
Technical analysis
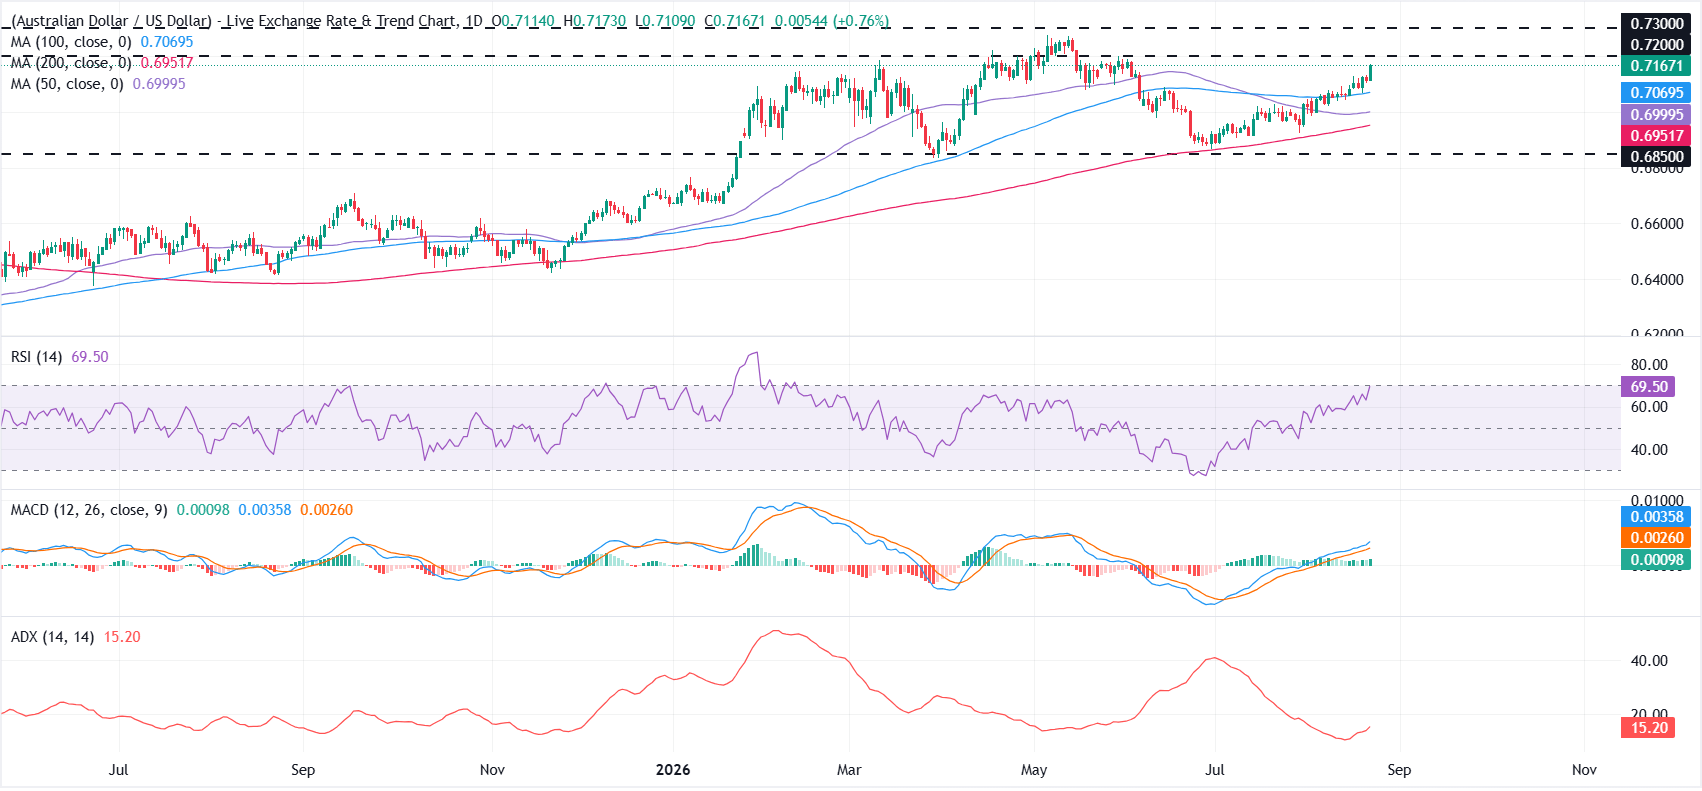
AUD/USD keeps a bullish near-term tone as it holds above the 50-day, 100-day and 200-day Simple Moving Averages (SMAs) clustered between 0.6952 and 0.7070.
The Relative Strength Index (RSI) on the daily chart is at 69 and flirts with overbought territory, while the Moving Average Convergence Divergence (MACD) indicator remains slightly positive, suggesting the latest advance is stretched but still supported by constructive momentum within a relatively low-trend ADX backdrop.
On the topside, initial resistance emerges at the horizontal barrier near 0.7200, ahead of a higher cap at 0.7300. On the downside, immediate support is provided by the latest close area at 0.7166, with deeper demand seen at the 100-day SMA around 0.7070 and the 50-day SMA near 0.6999, before the 200-day SMA at 0.6952 and the structural floor at 0.6850.
(The technical analysis of this story was written with the help of an AI tool. Know more.)
RBA FAQs
The Reserve Bank of Australia (RBA) sets interest rates and manages monetary policy for Australia. Decisions are made by a board of governors at 11 meetings a year and ad hoc emergency meetings as required. The RBA’s primary mandate is to maintain price stability, which means an inflation rate of 2-3%, but also “..to contribute to the stability of the currency, full employment, and the economic prosperity and welfare of the Australian people.” Its main tool for achieving this is by raising or lowering interest rates. Relatively high interest rates will strengthen the Australian Dollar (AUD) and vice versa. Other RBA tools include quantitative easing and tightening.
While inflation had always traditionally been thought of as a negative factor for currencies since it lowers the value of money in general, the opposite has actually been the case in modern times with the relaxation of cross-border capital controls. Moderately higher inflation now tends to lead central banks to put up their interest rates, which in turn has the effect of attracting more capital inflows from global investors seeking a lucrative place to keep their money. This increases demand for the local currency, which in the case of Australia is the Aussie Dollar.
Macroeconomic data gauges the health of an economy and can have an impact on the value of its currency. Investors prefer to invest their capital in economies that are safe and growing rather than precarious and shrinking. Greater capital inflows increase the aggregate demand and value of the domestic currency. Classic indicators, such as GDP, Manufacturing and Services PMIs, employment, and consumer sentiment surveys can influence AUD. A strong economy may encourage the Reserve Bank of Australia to put up interest rates, also supporting AUD.
Quantitative Easing (QE) is a tool used in extreme situations when lowering interest rates is not enough to restore the flow of credit in the economy. QE is the process by which the Reserve Bank of Australia (RBA) prints Australian Dollars (AUD) for the purpose of buying assets – usually government or corporate bonds – from financial institutions, thereby providing them with much-needed liquidity. QE usually results in a weaker AUD.
Quantitative tightening (QT) is the reverse of QE. It is undertaken after QE when an economic recovery is underway and inflation starts rising. Whilst in QE the Reserve Bank of Australia (RBA) purchases government and corporate bonds from financial institutions to provide them with liquidity, in QT the RBA stops buying more assets, and stops reinvesting the principal maturing on the bonds it already holds. It would be positive (or bullish) for the Australian Dollar.
Author

Vishal Chaturvedi
FXStreet
I am a macro-focused research analyst with over four years of experience covering forex and commodities market. I enjoy breaking down complex economic trends and turning them into clear, actionable insights that help traders stay ahead of the curve.
















