AUD/USD falls back to 0.6700 as Aussie grinds lower
- The Aussie is down 0.4% against the Greenback as the AUD deflates.
- Thursday’s early risk-bid on China PMI beats gave way to pre-NFP positioning.
- USD NFP Friday to close out the first trading week of 2024.

The AUD/USD continued to backslide on Thursday, slipping back into the 0.6700 handle after a short-lived rally sparked by improving risk sentiment on the back of a better-than-expected print in China’s Caixin Services Purchasing Managers’ Index (PMI) for December.
Investors are gearing up for a fresh print of the the US Nonfarm Payrolls report for December to wrap up the first trading week of 2024, and markets are expecting the latest labor figures from the US to show 170K new jobs additions for the last reporting period of 2023, compared to November’s 199K.
Investors scrambled to revise their NFP forecasts upwards after Thursday’s US ADP Employment Change broadly beat estimates, showing ADP payrolls increased by a net 164K job additions compared to the median market forecast of 115K, versus the previous month’s 101K (revised down slightly from 103K). However, given the widening gap between official employment figures and private ‘preview’ data, investors should practice caution as discrepancies continue to plague employment pre-NFP figures.

Australian Dollar price today
The table below shows the percentage change of Australian Dollar (AUD) against listed major currencies today. Australian Dollar was the strongest against the Japanese Yen.
| USD | EUR | GBP | CAD | AUD | JPY | NZD | CHF | |
| USD | -0.22% | -0.08% | 0.04% | 0.42% | 1.10% | 0.24% | 0.11% | |
| EUR | 0.22% | 0.14% | 0.26% | 0.63% | 1.32% | 0.45% | 0.33% | |
| GBP | 0.08% | -0.13% | 0.12% | 0.49% | 1.18% | 0.33% | 0.20% | |
| CAD | -0.04% | -0.25% | -0.12% | 0.38% | 1.06% | 0.20% | 0.11% | |
| AUD | -0.41% | -0.63% | -0.49% | -0.37% | 0.69% | -0.17% | -0.30% | |
| JPY | -1.12% | -1.32% | -1.21% | -1.07% | -0.77% | -0.89% | -0.99% | |
| NZD | -0.24% | -0.46% | -0.33% | -0.19% | 0.17% | 0.86% | -0.13% | |
| CHF | -0.12% | -0.33% | -0.20% | -0.07% | 0.30% | 0.98% | 0.13% |
The heat map shows percentage changes of major currencies against each other. The base currency is picked from the left column, while the quote currency is picked from the top row. For example, if you pick the Euro from the left column and move along the horizontal line to the Japanese Yen, the percentage change displayed in the box will represent EUR (base)/JPY (quote).
AUD/USD Technical Outlook
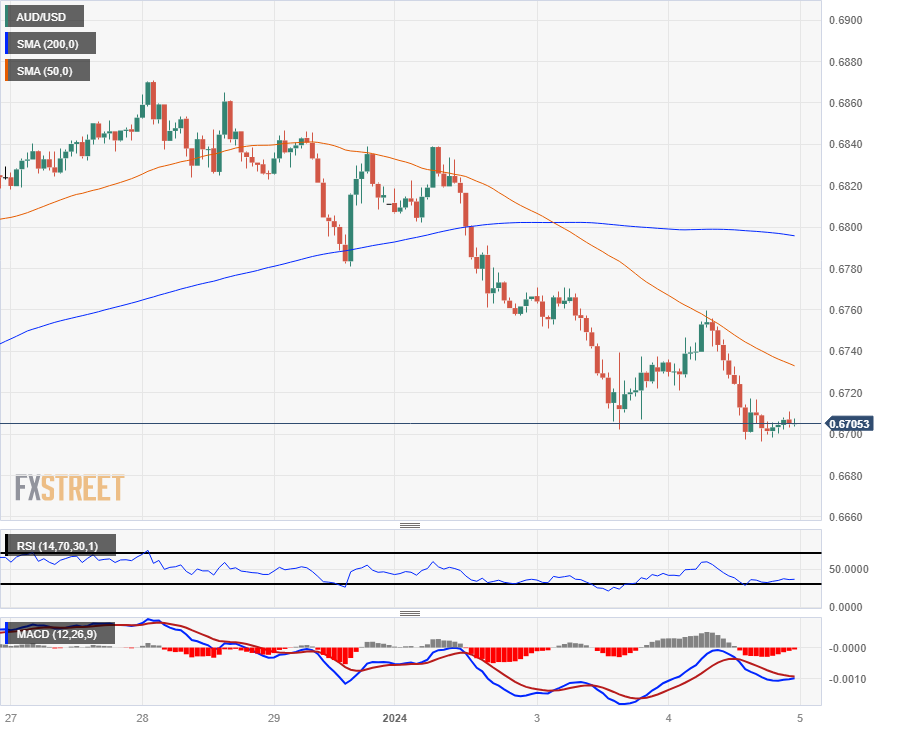
The AUD/USD is trading on the bottom side of the 200-hour Simple Moving Average (SMA), running aground of the 0.6700 handle as near-term momentum pins firmly into the bearish side with a downside cross of the 50-hour and 200-hour SMAs near 0.6800 acting as a short-term technical ceiling.
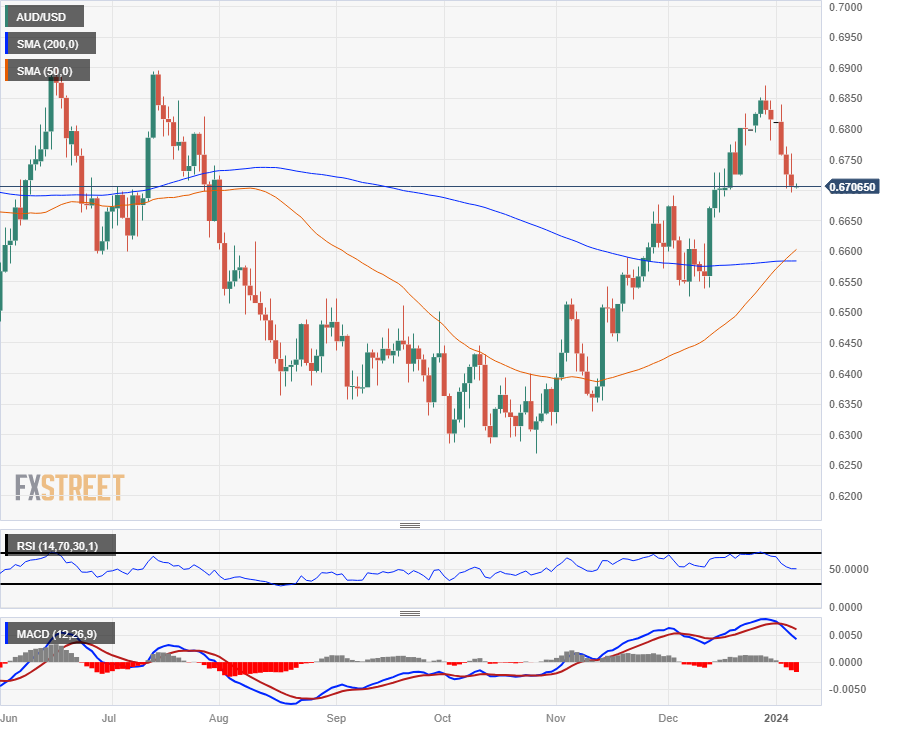
The Aussie has closed in the red for five consecutive trading days, declining nearly 2.5% from late December’s peak near 0.6870.
The AUD/USD’s downturn sets the pair up for a fresh bearish challenge of the 0.6600 handle, though bidders could look for a bullish bounce from the topside crossover of the 50-day and 200-day SMAs just below 0.6600.
AUD/USD Hourly Chart
AUD/USD Daily Chart
AUD/USD Technical Levels
Author

Joshua Gibson
FXStreet
Joshua joins the FXStreet team as an Economics and Finance double major from Vancouver Island University with twelve years' experience as an independent trader focusing on technical analysis.

















