AUD/JPY Price Forecast: Bears defend 50-day SMA as intervention risks linger
- AUD/JPY trades sideways near multi-decade highs as traders monitor the risk of intervention from Japanese authorities with USD/JPY holding above 160.
- Japanese officials reiterate their readiness to respond to excessive currency moves.
- Wide interest-rate differentials continue to weigh on the Japanese Yen and underpin Yen crosses.

AUD/JPY extends its sideways price action on Monday near levels last seen in September 1990, as persistent weakness in the Japanese Yen (JPY) keeps the cross supported while fears of another intervention by Japanese authorities limit further gains. At the time of writing, the cross is trading around 113.00, easing from an intraday high of 113.44.
The Japanese Yen remains under pressure, with USD/JPY trading near 161.50, close to its weakest level since 1986. The move has revived concerns over another intervention by Japanese authorities after Tokyo stepped into the market earlier this year when USD/JPY rose above 160.00.
Japanese Finance Minister Satsuki Katayama reiterated on Monday that authorities stand ready to respond to excessive currency moves if necessary.
Against this backdrop, Yen crosses are likely to remain volatile. Meanwhile, wide interest-rate differentials between the Bank of Japan (BoJ) and other major central banks remain a headwind for the Japanese Yen.
Looking ahead, traders will keep a close eye on this week's economic calendar, including Australia's Consumer Price Index (CPI) and labor market data, as well as Tokyo inflation figures. These releases are likely to set the tone for near-term price action in AUD/JPY.
Technical Analysis:
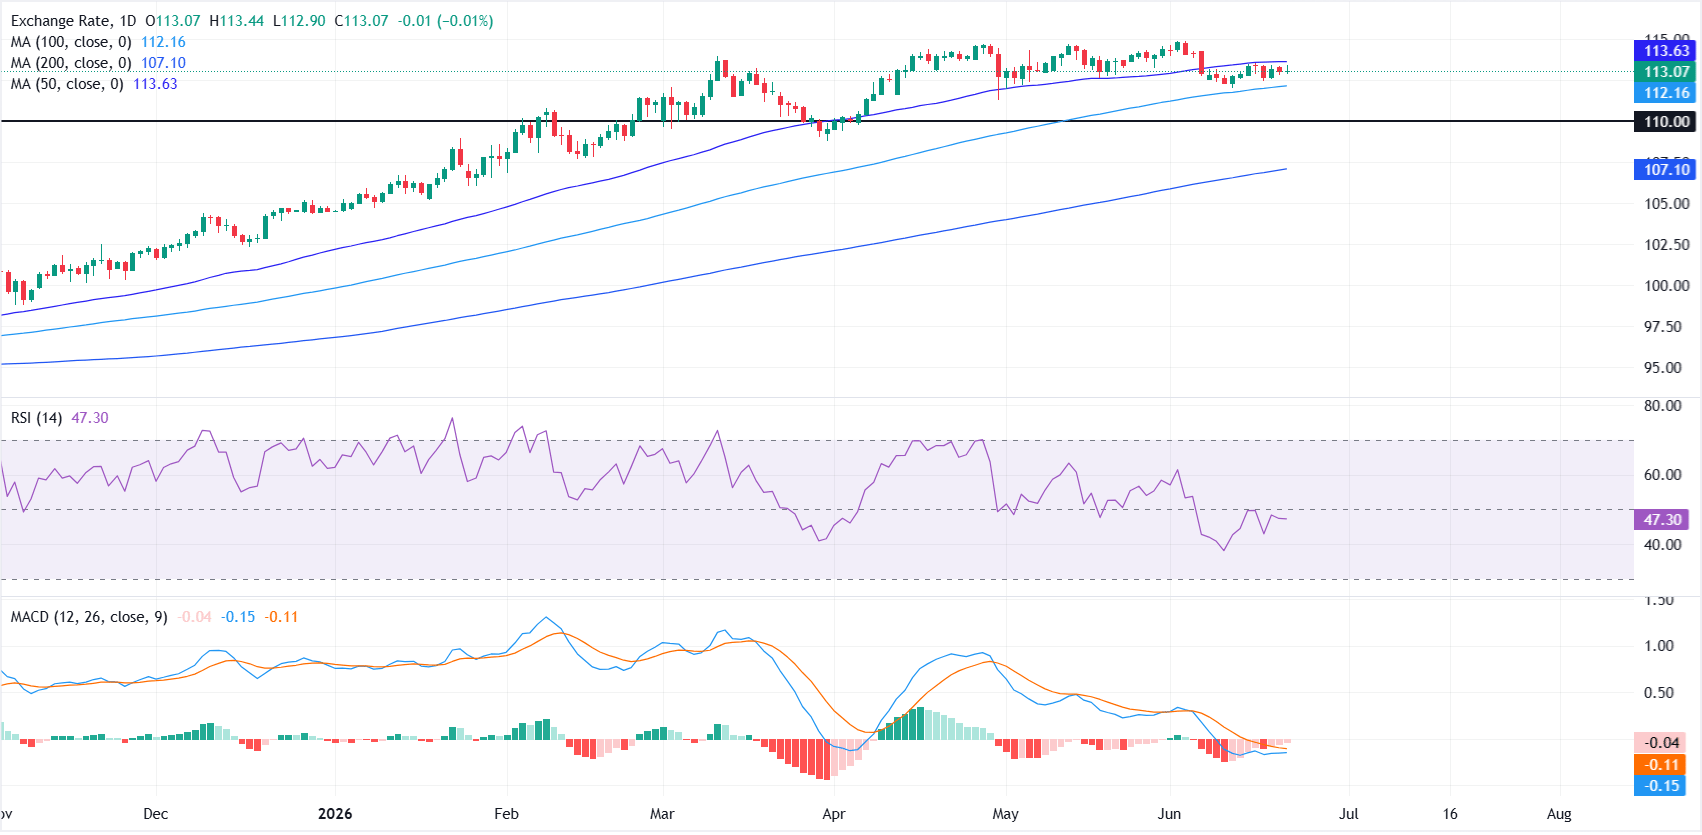
In the daily chart, AUD/JPY holds below the 50-day Simple Moving Average (SMA) at 113.63 while still trading above the 100-day SMA at 112.16, which leaves the cross in a neutral-to-bearish near-term stance.
The broader uptrend backdrop defined by the 200-day SMA near 107.10 remains intact, but a negative Moving Average Convergence Divergence (MACD) reading and a Relative Strength Index (RSI) around the mid-40s hint that upside momentum is fading and that rallies could struggle while price stays capped beneath the 50-day SMA.
On the topside, initial resistance appears at the 50-day SMA around 113.63, and a daily close above this barrier would be needed to ease the current corrective tone and reopen the path toward higher highs. On the downside, immediate support is seen at the 100-day SMA near 112.16, ahead of the horizontal floor around 110.00, while the 200-day SMA at 107.10 stands as a deeper medium-term support should selling extend.
(The technical analysis of this story was written with the help of an AI tool.)
Japanese Yen Price Today
The table below shows the percentage change of Japanese Yen (JPY) against listed major currencies today. Japanese Yen was the strongest against the New Zealand Dollar.
| USD | EUR | GBP | JPY | CAD | AUD | NZD | CHF | |
|---|---|---|---|---|---|---|---|---|
| USD | 0.38% | -0.07% | 0.11% | 0.04% | 0.12% | 0.43% | 0.23% | |
| EUR | -0.38% | -0.46% | -0.26% | -0.36% | -0.23% | 0.07% | -0.15% | |
| GBP | 0.07% | 0.46% | 0.19% | 0.13% | 0.22% | 0.53% | 0.32% | |
| JPY | -0.11% | 0.26% | -0.19% | -0.07% | 0.00% | 0.31% | 0.14% | |
| CAD | -0.04% | 0.36% | -0.13% | 0.07% | 0.07% | 0.37% | 0.21% | |
| AUD | -0.12% | 0.23% | -0.22% | -0.01% | -0.07% | 0.33% | 0.13% | |
| NZD | -0.43% | -0.07% | -0.53% | -0.31% | -0.37% | -0.33% | -0.18% | |
| CHF | -0.23% | 0.15% | -0.32% | -0.14% | -0.21% | -0.13% | 0.18% |
The heat map shows percentage changes of major currencies against each other. The base currency is picked from the left column, while the quote currency is picked from the top row. For example, if you pick the Japanese Yen from the left column and move along the horizontal line to the US Dollar, the percentage change displayed in the box will represent JPY (base)/USD (quote).
Author

Vishal Chaturvedi
FXStreet
I am a macro-focused research analyst with over four years of experience covering forex and commodities market. I enjoy breaking down complex economic trends and turning them into clear, actionable insights that help traders stay ahead of the curve.